📊 Intraday Support & Resistance Levels
Immediate Support: ₹442.00 – A level where buyers have previously shown interest.
Immediate Resistance: ₹455.90 – A recent high that may act as a barrier to upward movement.
Additional Resistance Levels:
₹461.80
₹470.70
₹479.60
₹494.00
Additional Support Levels:
₹427.50
₹436.40
🔍 Technical Indicators
Relative Strength Index (RSI): Approximately 41.05, indicating a neutral to bearish momentum.
Moving Average Convergence Divergence (MACD): At -1.680, suggesting a bearish trend.
Average Directional Index (ADX): Around 21.33, indicating a weak trend strength.
Stochastic Oscillator: Approximately 63.96, pointing to neutral momentum.
⚠️ Trade Considerations
Bullish Scenario: If the price sustains above ₹442.00, there may be potential for a rebound towards ₹455.90.
Bearish Scenario: A drop below ₹442.00 could lead to further declines, possibly testing lower support levels.
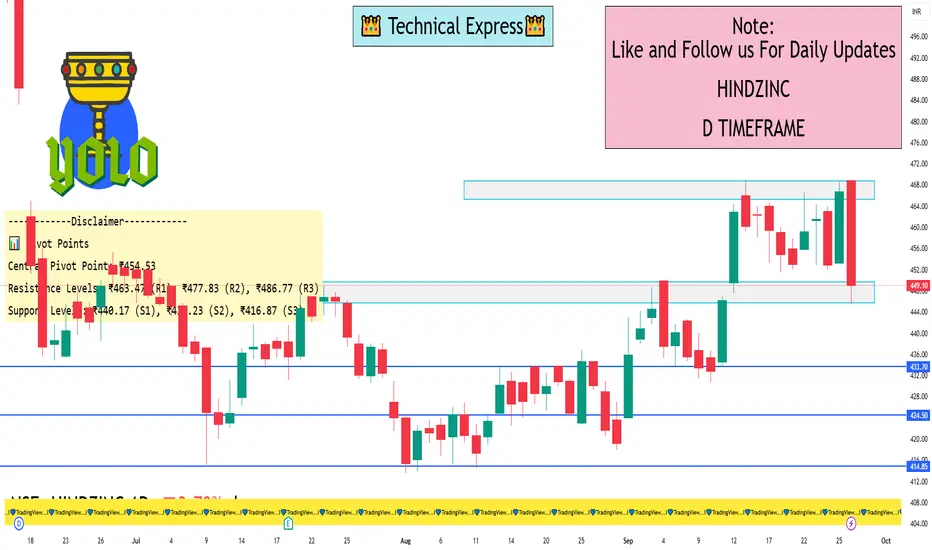
📊 Pivot Points
Central Pivot Point: ₹454.53
Resistance Levels: ₹463.47 (R1), ₹477.83 (R2), ₹486.77 (R3)
Support Levels: ₹440.17 (S1), ₹431.23 (S2), ₹416.87 (S3)
📝 Outlook
Bullish Scenario: If the price sustains above ₹442.00, there may be potential for a rebound towards ₹455.90.
Bearish Scenario: A drop below ₹442.00 could lead to further declines, possibly testing lower support levels.
Immediate Support: ₹442.00 – A level where buyers have previously shown interest.
Immediate Resistance: ₹455.90 – A recent high that may act as a barrier to upward movement.
Additional Resistance Levels:
₹461.80
₹470.70
₹479.60
₹494.00
Additional Support Levels:
₹427.50
₹436.40
🔍 Technical Indicators
Relative Strength Index (RSI): Approximately 41.05, indicating a neutral to bearish momentum.
Moving Average Convergence Divergence (MACD): At -1.680, suggesting a bearish trend.
Average Directional Index (ADX): Around 21.33, indicating a weak trend strength.
Stochastic Oscillator: Approximately 63.96, pointing to neutral momentum.
⚠️ Trade Considerations
Bullish Scenario: If the price sustains above ₹442.00, there may be potential for a rebound towards ₹455.90.
Bearish Scenario: A drop below ₹442.00 could lead to further declines, possibly testing lower support levels.
📊 Pivot Points
Central Pivot Point: ₹454.53
Resistance Levels: ₹463.47 (R1), ₹477.83 (R2), ₹486.77 (R3)
Support Levels: ₹440.17 (S1), ₹431.23 (S2), ₹416.87 (S3)
📝 Outlook
Bullish Scenario: If the price sustains above ₹442.00, there may be potential for a rebound towards ₹455.90.
Bearish Scenario: A drop below ₹442.00 could lead to further declines, possibly testing lower support levels.
I built a Buy & Sell Signal Indicator with 85% accuracy.
📈 Get access via DM or
WhatsApp: wa.link/d997q0
Contact - +91 76782 40962
| Email: techncialexpress@gmail.com
| Script Coder | Trader | Investor | From India
📈 Get access via DM or
WhatsApp: wa.link/d997q0
Contact - +91 76782 40962
| Email: techncialexpress@gmail.com
| Script Coder | Trader | Investor | From India
관련 발행물
면책사항
해당 정보와 게시물은 금융, 투자, 트레이딩 또는 기타 유형의 조언이나 권장 사항으로 간주되지 않으며, 트레이딩뷰에서 제공하거나 보증하는 것이 아닙니다. 자세한 내용은 이용 약관을 참조하세요.