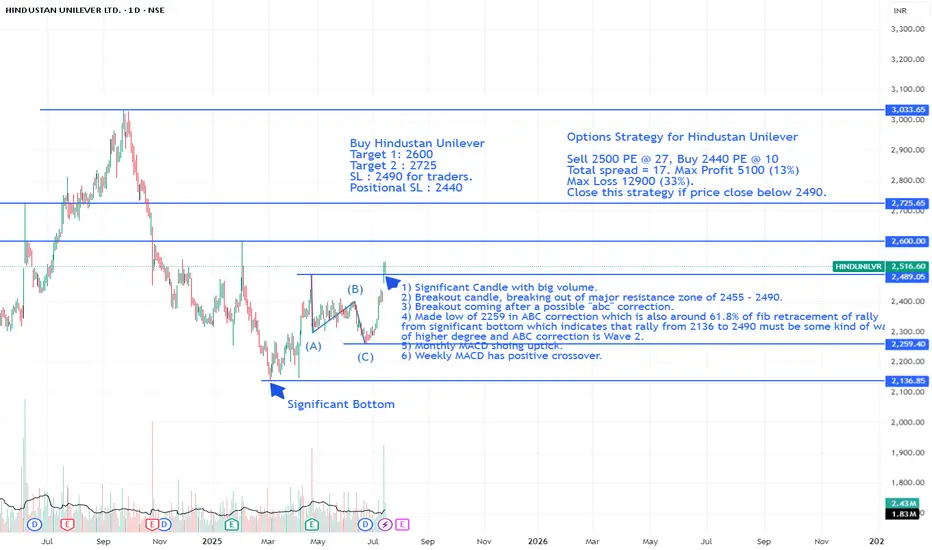
Hindustan Unilever is showing a bullish momentum. Price did a gap up on Friday 11 July, 2025 giving a closing of Rs. 2516. With a 4% rise, HINDUNILVR is challenging Bollinger bands on daily as well as weekly time frame.
On a weekly time frame, MACD has positive crossover and ADX is showing strength of bullishness of the trend.
As per Elliot Wave theory, stock did a Wave 1 and Wave 2 on the charts in daily time frame making a low of Rs. 2259 in wave 2. After closing above 2490, stock made a higher high and is confirming dow theory for upward trend.
A bullish trade can be taken to benefit from the rising trend. A Strick SL should be kept at 2490 for those trading derivatives and at 2440 for positional traders. Target could range from 2600-2700 in short run to 3000 in long run.
📢 Disclaimer (Please Read Carefully)
The content shared herein is solely for educational and informational purposes and does not constitute financial, investment, or trading advice. I am not a SEBI registered analyst. The views expressed are personal opinions and should not be construed as recommendations.
Market investments, including derivatives and F&O, carry risk. Please do your own research and consult a qualified financial advisor before making any investment decisions.
Do not consider this post as a basis for trading decisions. It is intended to offer a different perspective, whether that aligns with or challenges your existing view.
🔒 No liability shall be accepted for any loss or damage arising directly or indirectly from reliance on this content.
If you find this analysis valuable, feel free to BOOST and share your thoughts in the comments. I appreciate respectful dialogue and diverse viewpoints.
액티브 트레이드
SL Hit. Exit the trade.면책사항
해당 정보와 게시물은 금융, 투자, 트레이딩 또는 기타 유형의 조언이나 권장 사항으로 간주되지 않으며, 트레이딩뷰에서 제공하거나 보증하는 것이 아닙니다. 자세한 내용은 이용 약관을 참조하세요.
면책사항
해당 정보와 게시물은 금융, 투자, 트레이딩 또는 기타 유형의 조언이나 권장 사항으로 간주되지 않으며, 트레이딩뷰에서 제공하거나 보증하는 것이 아닙니다. 자세한 내용은 이용 약관을 참조하세요.