Most traders love chasing green candles. Professionals study pullbacks — because they reveal who’s really in control.
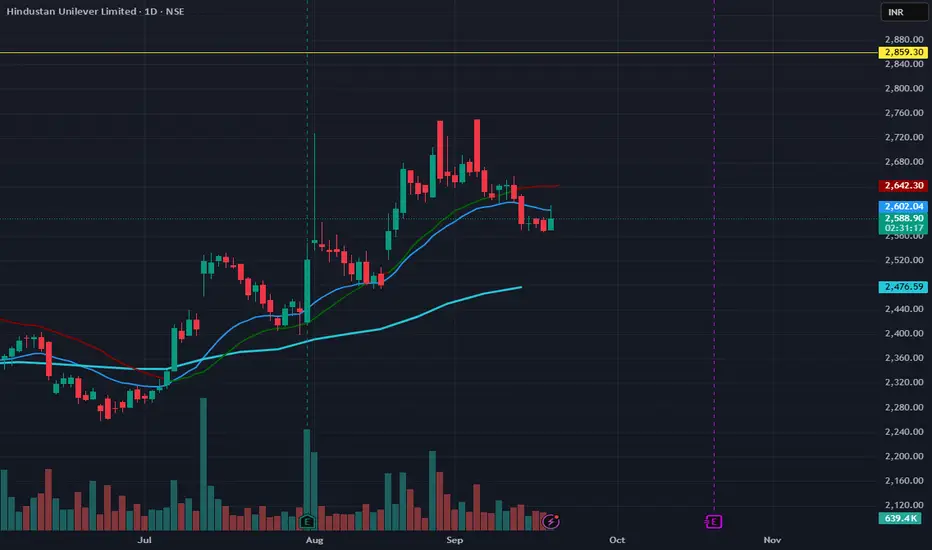
🔎 What the Chart Shows (HUL)
Strong run-up July–Aug → clear trend.
Recent pullback into 2600 zone.
20 & 50 MA curling sideways → buyers losing some steam.
200 MA still rising → long-term trend intact.
✅ How to Use This
Weak pullback (low volume, shallow retrace): Often resumes trend.
Strong pullback (heavy selling, breaks 50MA): Trend shift risk.
Here → buyers defending near ₹2,590–2,600. A bounce above ₹2,642 could confirm strength.
👉 Lesson: Don’t fear pullbacks — read them. They tell you if trend is resting or reversing.
💡 Save this chart. Follow for daily technical education with trader psychology.
Started like everyone else — chasing trends, ignoring risk.
Learned the hard way that survival beats prediction.
Now I share structured equity views and hedged options plays using Renko and macro context — built for consistency, not dopamine.
Learned the hard way that survival beats prediction.
Now I share structured equity views and hedged options plays using Renko and macro context — built for consistency, not dopamine.
면책사항
해당 정보와 게시물은 금융, 투자, 트레이딩 또는 기타 유형의 조언이나 권장 사항으로 간주되지 않으며, 트레이딩뷰에서 제공하거나 보증하는 것이 아닙니다. 자세한 내용은 이용 약관을 참조하세요.