🟢 Hindustan Unilever Limited – Possible Reversal from Support Zone
Timeframe: 1 Hour (Heikin Ashi)
Structure: Price approaching demand zone
🔍 Analysis:
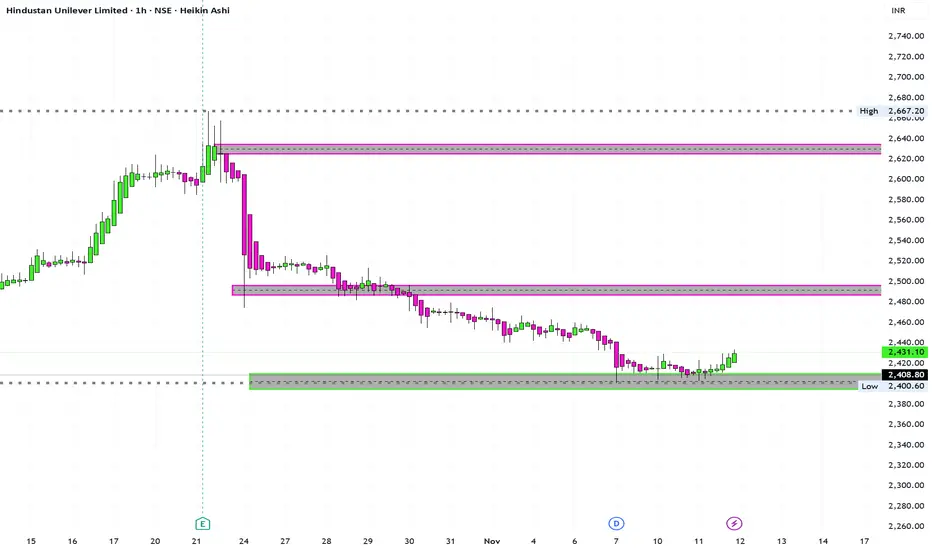
The stock has been in a consistent downtrend and is now testing a strong support zone near ₹2400–₹2410.
Multiple rejections from this zone indicate buying interest at lower levels.
Immediate resistance zones are observed around ₹2480 and ₹2630.
If price sustains above ₹2435–₹2440, a short-term reversal toward ₹2480 could be expected.
⚙️ Trading Plan (for observation):
Entry Zone: ₹2410–₹2430
Target 1: ₹2480
Target 2: ₹2630
Stop Loss: Below ₹2390 (on closing basis)
🧭 Summary:
The structure suggests a potential base formation at the current demand zone. A breakout above ₹2440 may confirm a reversal toward higher resistances.
Timeframe: 1 Hour (Heikin Ashi)
Structure: Price approaching demand zone
🔍 Analysis:
The stock has been in a consistent downtrend and is now testing a strong support zone near ₹2400–₹2410.
Multiple rejections from this zone indicate buying interest at lower levels.
Immediate resistance zones are observed around ₹2480 and ₹2630.
If price sustains above ₹2435–₹2440, a short-term reversal toward ₹2480 could be expected.
⚙️ Trading Plan (for observation):
Entry Zone: ₹2410–₹2430
Target 1: ₹2480
Target 2: ₹2630
Stop Loss: Below ₹2390 (on closing basis)
🧭 Summary:
The structure suggests a potential base formation at the current demand zone. A breakout above ₹2440 may confirm a reversal toward higher resistances.
액티브 트레이드
면책사항
해당 정보와 게시물은 금융, 투자, 트레이딩 또는 기타 유형의 조언이나 권장 사항으로 간주되지 않으며, 트레이딩뷰에서 제공하거나 보증하는 것이 아닙니다. 자세한 내용은 이용 약관을 참조하세요.
면책사항
해당 정보와 게시물은 금융, 투자, 트레이딩 또는 기타 유형의 조언이나 권장 사항으로 간주되지 않으며, 트레이딩뷰에서 제공하거나 보증하는 것이 아닙니다. 자세한 내용은 이용 약관을 참조하세요.