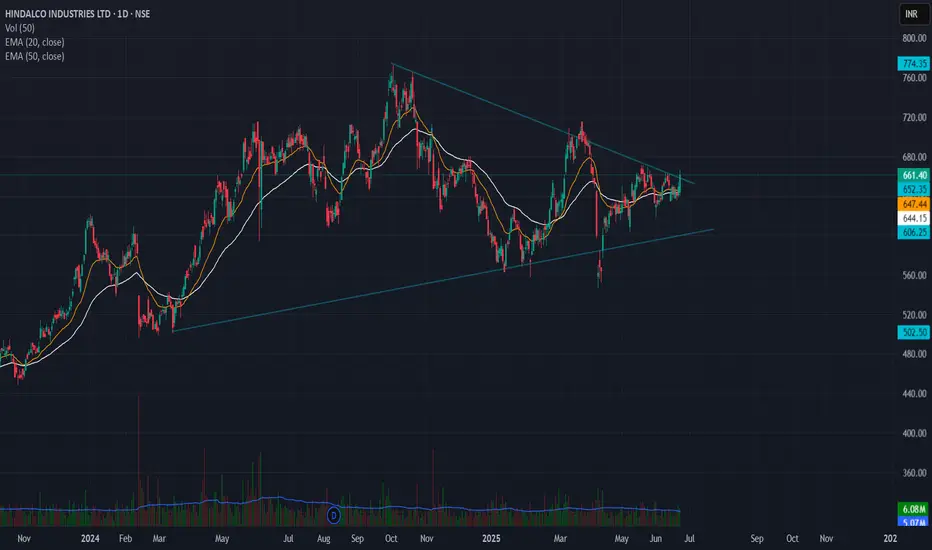
🔹 Pattern: Symmetrical Triangle
🔹 Breakout Level: ₹660
🔹 Stoploss: ₹635 (below swing low)
🔹 Target Zone: ₹850 – ₹900
🔹 Risk–Reward: 7.6 – 9.6
🔹 Timeframe: Positional (swing to medium term)
---
📊 Chart Analysis:
Hindalco has broken out of a well-defined symmetrical triangle on the daily chart, with strong price compression followed by bullish breakout confirmation.
The triangle height is ~₹200, projected from the breakout zone, giving a target range of ₹850–₹900.
🧠 Stoploss placed below the last swing low inside the triangle to avoid false breakdown traps.
면책사항
해당 정보와 게시물은 금융, 투자, 트레이딩 또는 기타 유형의 조언이나 권장 사항으로 간주되지 않으며, 트레이딩뷰에서 제공하거나 보증하는 것이 아닙니다. 자세한 내용은 이용 약관을 참조하세요.
면책사항
해당 정보와 게시물은 금융, 투자, 트레이딩 또는 기타 유형의 조언이나 권장 사항으로 간주되지 않으며, 트레이딩뷰에서 제공하거나 보증하는 것이 아닙니다. 자세한 내용은 이용 약관을 참조하세요.