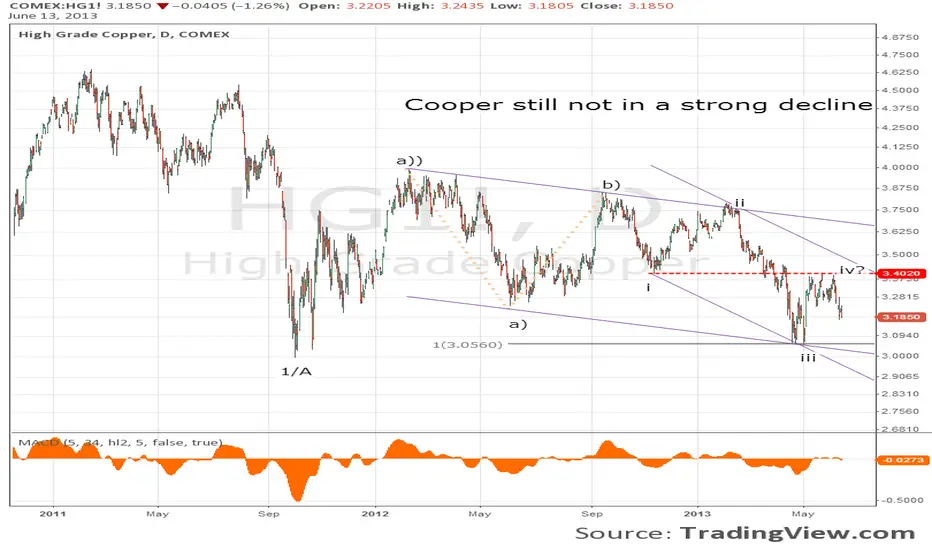
As we can see in this chart after the first strong down side movement since the 4.64 the price have been stocked with what seems to be a standard flat, and where the b wave is near to it's end (unless its 5th wave extends)
Therefore (and confirmed by the base channel as far as now) is logical to expect that after a new visit to the lows near the end of wave 1/A the price retraces over the a)) wave highs arround the 4.00 before a new decline appears.
This is interesting at this point because the cooper has been saw as indicator of the health of the economy.
면책사항
이 정보와 게시물은 TradingView에서 제공하거나 보증하는 금융, 투자, 거래 또는 기타 유형의 조언이나 권고 사항을 의미하거나 구성하지 않습니다. 자세한 내용은 이용 약관을 참고하세요.
면책사항
이 정보와 게시물은 TradingView에서 제공하거나 보증하는 금융, 투자, 거래 또는 기타 유형의 조언이나 권고 사항을 의미하거나 구성하지 않습니다. 자세한 내용은 이용 약관을 참고하세요.