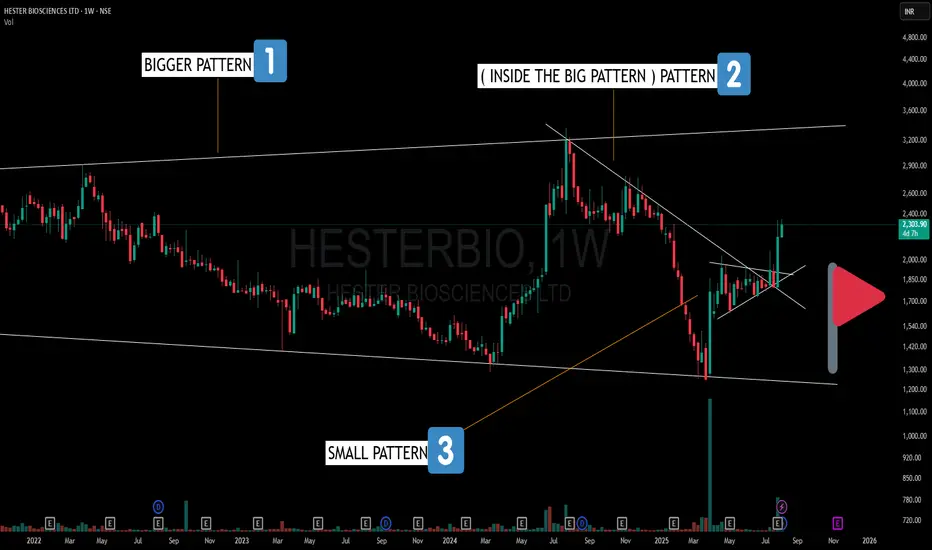
🔍 Here’s what stands out on the Weekly Chart:
1️⃣ Broadening Pattern – Larger structure with higher highs and lower lows, indicating expanding volatility.
2️⃣ Counter Trendline Break – A smaller, random pattern within the broadening formation showing V-shape recoveries and trend shifts.
3️⃣ Bullish Pennant – A compact consolidation pattern just before a strong breakout leg.
This is a great example of how multiple time-frame structures and nested patterns can co-exist—each adding another layer to market behavior.
🎯 Master My Self-Made Trading Strategy
📈 Telegram (Learn Today): t.me/hashtaghammer
✅ WhatsApp (Learn Today): wa.me/919455664601
📈 Telegram (Learn Today): t.me/hashtaghammer
✅ WhatsApp (Learn Today): wa.me/919455664601
관련 발행물
면책사항
해당 정보와 게시물은 금융, 투자, 트레이딩 또는 기타 유형의 조언이나 권장 사항으로 간주되지 않으며, 트레이딩뷰에서 제공하거나 보증하는 것이 아닙니다. 자세한 내용은 이용 약관을 참조하세요.