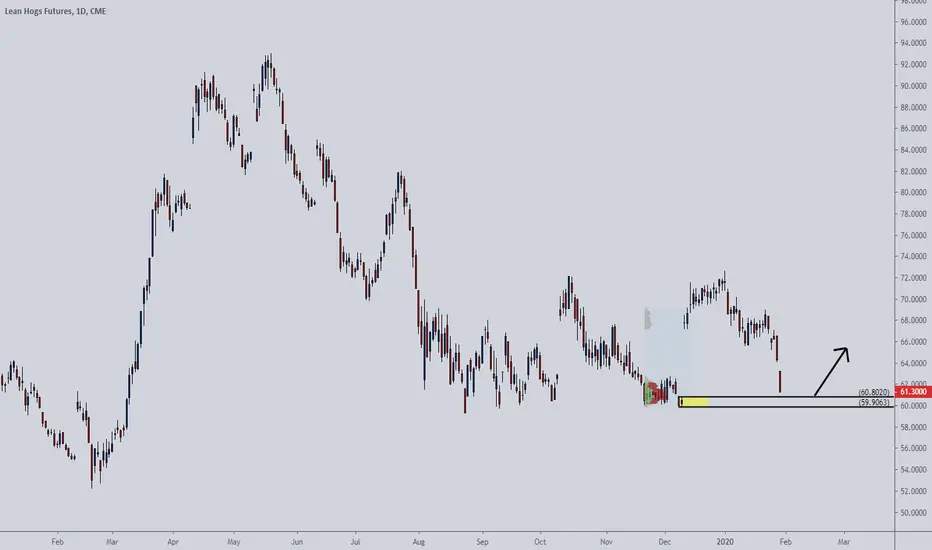
A long red candle has formed on the daily chart. A strong gap down, however, I identified a volume cluster just below the current price. If buyers are strong, they will push the price up again. A strong demand zone is also just below the current price.
Our target is 1 to 1, and the stop is a close, on the daily chart, below the lower line.
Our target is 1 to 1, and the stop is a close, on the daily chart, below the lower line.
면책사항
이 정보와 게시물은 TradingView에서 제공하거나 보증하는 금융, 투자, 거래 또는 기타 유형의 조언이나 권고 사항을 의미하거나 구성하지 않습니다. 자세한 내용은 이용 약관을 참고하세요.
면책사항
이 정보와 게시물은 TradingView에서 제공하거나 보증하는 금융, 투자, 거래 또는 기타 유형의 조언이나 권고 사항을 의미하거나 구성하지 않습니다. 자세한 내용은 이용 약관을 참고하세요.