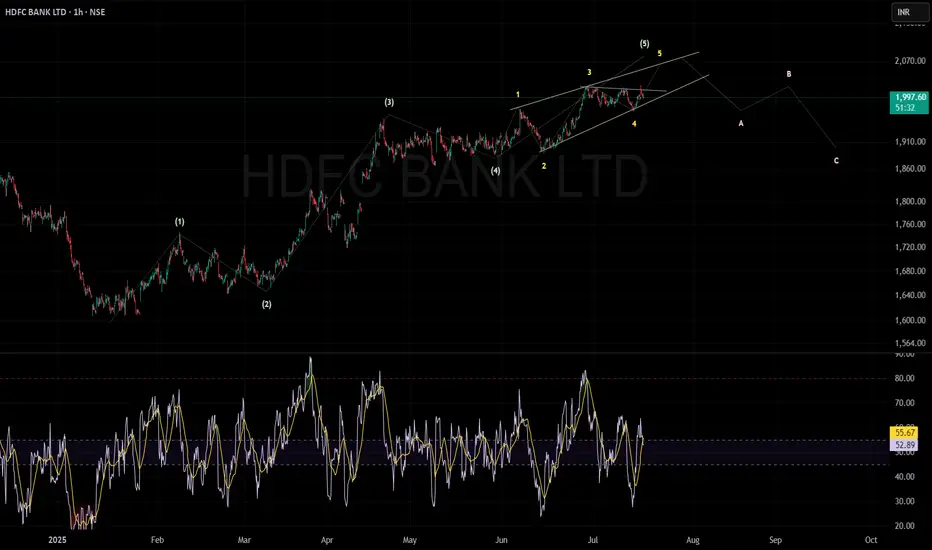
HDFC Bank is currently in the last (5th) wave of an uptrend. This wave is moving inside a narrow, rising wedge pattern called an ending diagonal.
The price can move higher towards ₹2,050–₹2,100 before the trend finishes.
If the price breaks below the bottom of the wedge pattern (ending diagonal), it could confirm a trend reversal, likely leading to a correction.
After the peak, the chart suggests a three-step drop (A, B, and C waves), with possible support around ₹1,910 and then ₹1,850.
The RSI (Relative Strength Index) is around 53, meaning the trend isn't overbought or oversold yet.
In short: The uptrend is close to ending. Watch for a break below the wedge—this could start a move down toward ₹1,910 first, then maybe ₹1,850.
면책사항
해당 정보와 게시물은 금융, 투자, 트레이딩 또는 기타 유형의 조언이나 권장 사항으로 간주되지 않으며, 트레이딩뷰에서 제공하거나 보증하는 것이 아닙니다. 자세한 내용은 이용 약관을 참조하세요.
면책사항
해당 정보와 게시물은 금융, 투자, 트레이딩 또는 기타 유형의 조언이나 권장 사항으로 간주되지 않으며, 트레이딩뷰에서 제공하거나 보증하는 것이 아닙니다. 자세한 내용은 이용 약관을 참조하세요.