CMP: 985
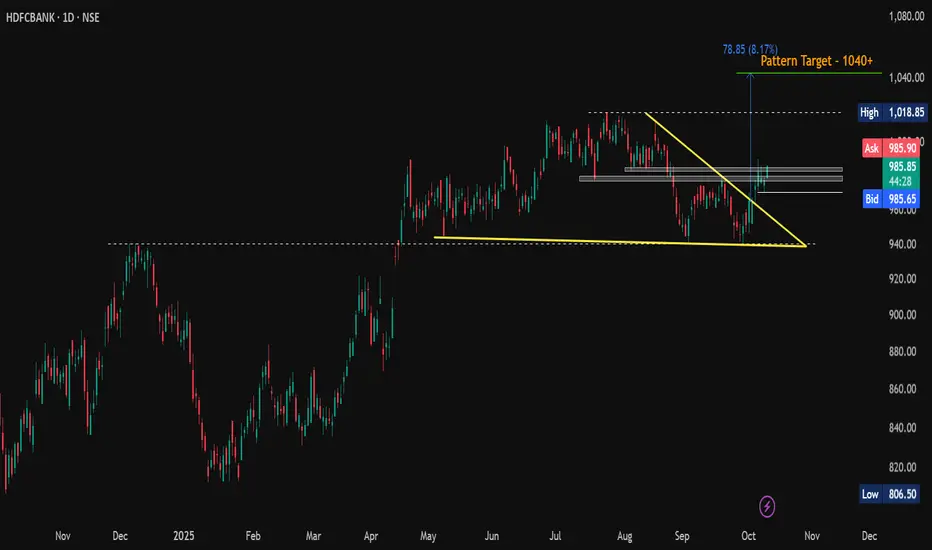
HDFCBANK has broken out of a falling wedge on the daily chart - a classic bullish reversal setup!
🔹 Chart Pattern: Falling Wedge Breakout
🔹 Breakout Confirmation: Price has decisively broken above the upper trendline
🔹 Retest Zone: Price is consolidating near the breakout zone (977 – 980), showing strength
🔹 Pattern Target: 1040+
🔹 Immediate Resistance: 985
🔹 Support Zones: 977 & 970
📈 A Daily Close Above 985 (DCB) can fuel momentum towards the wedge breakout target of 1040+.
#HDFCBANK | #BreakoutStocks | #FallingWedge | #ChartPatterns | #TechnicalAnalysis | #SwingTrading | #BullishBreakout
📌 Disclaimer: This analysis is shared for educational purposes only. It is not a buy/sell recommendation. Please do your own research before making any trading decisions.
면책사항
이 정보와 게시물은 TradingView에서 제공하거나 보증하는 금융, 투자, 거래 또는 기타 유형의 조언이나 권고 사항을 의미하거나 구성하지 않습니다. 자세한 내용은 이용 약관을 참고하세요.
면책사항
이 정보와 게시물은 TradingView에서 제공하거나 보증하는 금융, 투자, 거래 또는 기타 유형의 조언이나 권고 사항을 의미하거나 구성하지 않습니다. 자세한 내용은 이용 약관을 참고하세요.