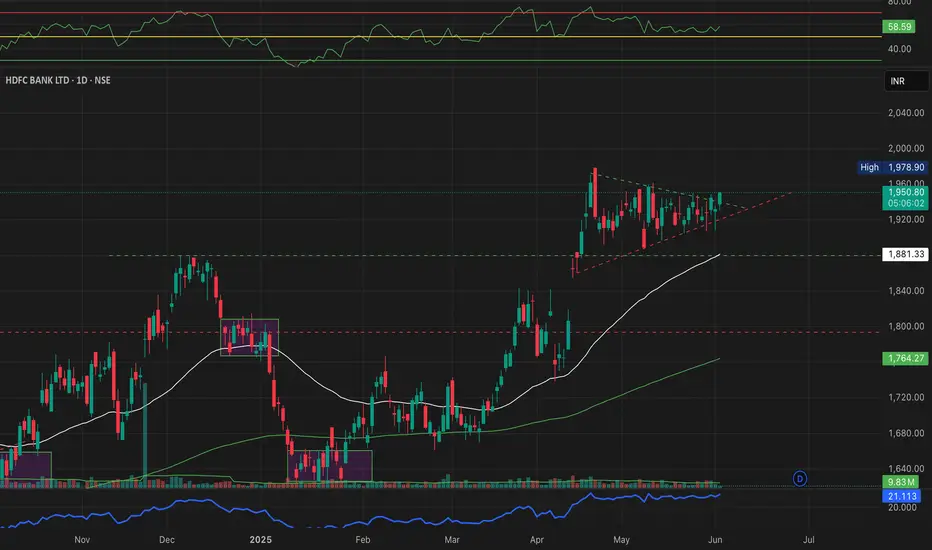
Symmetrical Triangle Tightening With Price Hovering Near Apex. Breakout Looks Imminent.
Price is also above 50 EMA, RSI around 56 - no extreme overbought zone, giving room for movement.
THIS LEVELS ARE PURELY BASED ON MANUAL PRICE ACTION - NO AUTO INDICATORS USED.
Will the triangle break upward or fakeout below? Let's Discuss in the comments!
All Levels hand - marked by Mayur Jayant Takalikar - based on clean structure & momentum zone spotting.
#HDFCBANK #PRICEACTION #TRADINGVIEWINDIA #CHARTANALYSIS #BREAKOUTSETUP #TRIANGLEPATTERN #SUPPORTRESISTANCE
면책사항
해당 정보와 게시물은 금융, 투자, 트레이딩 또는 기타 유형의 조언이나 권장 사항으로 간주되지 않으며, 트레이딩뷰에서 제공하거나 보증하는 것이 아닙니다. 자세한 내용은 이용 약관을 참조하세요.
면책사항
해당 정보와 게시물은 금융, 투자, 트레이딩 또는 기타 유형의 조언이나 권장 사항으로 간주되지 않으며, 트레이딩뷰에서 제공하거나 보증하는 것이 아닙니다. 자세한 내용은 이용 약관을 참조하세요.