🏦 HDFC – Trade Setup & Key Levels 📊
Analyzing HDFC on current chart structure with clear entry, exit, stop loss, support, and resistance zones.
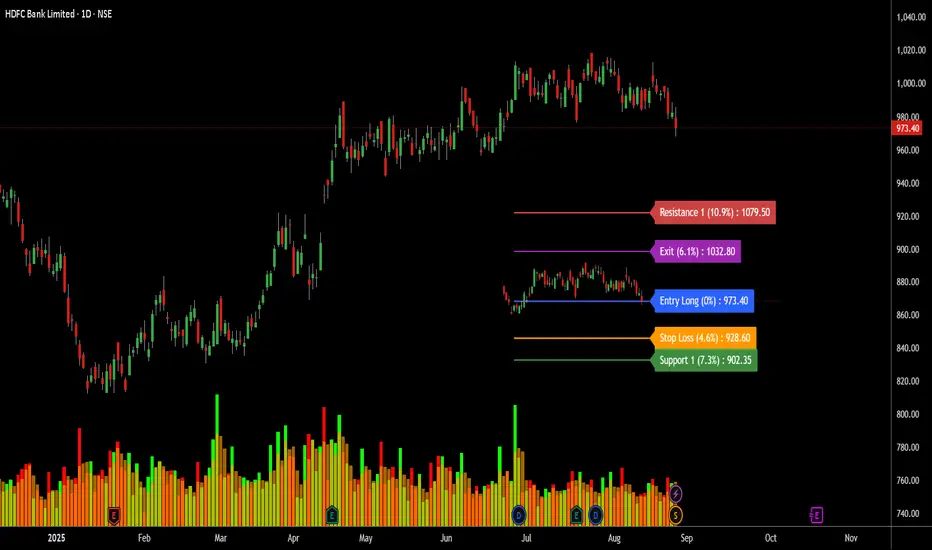
📌 **Entry Price (Long):** 973.40
🔑 Key Levels to Watch:
🔹 **Exit Target:** +6.1% → 1032.80
🔹 **Stop Loss:** -4.6% → 928.60
🔹 **Support Zone:** -7.3% → 902.35
🔹 **Resistance Zone:** +10.9% → 1079.50
Pine Script®
🔔 **Be sure to follow updated ideas for HDFC!** 🔔
⏰ **Timeframe:** Daily & 4H chart-based analysis.
⚖️ **Always apply a Stop Loss** to protect capital.
💡 **This is just my trading idea — follow your own strategy.**
✅ Don’t forget to hit the 'Like' ✅ 🙏😊 & Share with fellow traders if this setup helps!
Analyzing HDFC on current chart structure with clear entry, exit, stop loss, support, and resistance zones.
📌 **Entry Price (Long):** 973.40
🔑 Key Levels to Watch:
🔹 **Exit Target:** +6.1% → 1032.80
🔹 **Stop Loss:** -4.6% → 928.60
🔹 **Support Zone:** -7.3% → 902.35
🔹 **Resistance Zone:** +10.9% → 1079.50
HDFC is trading close to its support area. Entry is positioned at 973.40, with a favorable risk-to-reward ratio targeting 1032.80 first. Resistance remains higher at 1079.50, while downside risk is capped by the stop loss at 928.60.
- **Bullish View:** If momentum sustains above 973.40, price can aim for 1032.80 and later 1079.50.
- **Bearish View:** Breakdown below 928.60 may drag price lower toward 902.35 support.
⚠️ **Note:** If 928.60 breaks, expect further downside risk. ⚠️
🔔 **Be sure to follow updated ideas for HDFC!** 🔔
⏰ **Timeframe:** Daily & 4H chart-based analysis.
⚖️ **Always apply a Stop Loss** to protect capital.
💡 **This is just my trading idea — follow your own strategy.**
✅ Don’t forget to hit the 'Like' ✅ 🙏😊 & Share with fellow traders if this setup helps!
🌳Indicator: bit.ly/2DJVXDn 💚
🦄telegram: 🟢 t.me/longbuylongsellindicator 🟢
✔️contact: t.me/wealthworldmajic
🎯web: no.com
🟠twitter : twitter.com/marxcbabu 💲
youtube.com/@marxcbabu/videos
🦄telegram: 🟢 t.me/longbuylongsellindicator 🟢
✔️contact: t.me/wealthworldmajic
🎯web: no.com
🟠twitter : twitter.com/marxcbabu 💲
youtube.com/@marxcbabu/videos
면책사항
해당 정보와 게시물은 금융, 투자, 트레이딩 또는 기타 유형의 조언이나 권장 사항으로 간주되지 않으며, 트레이딩뷰에서 제공하거나 보증하는 것이 아닙니다. 자세한 내용은 이용 약관을 참조하세요.