숏
HDFC Bearish On 1H Chart
$NSE:HDFC
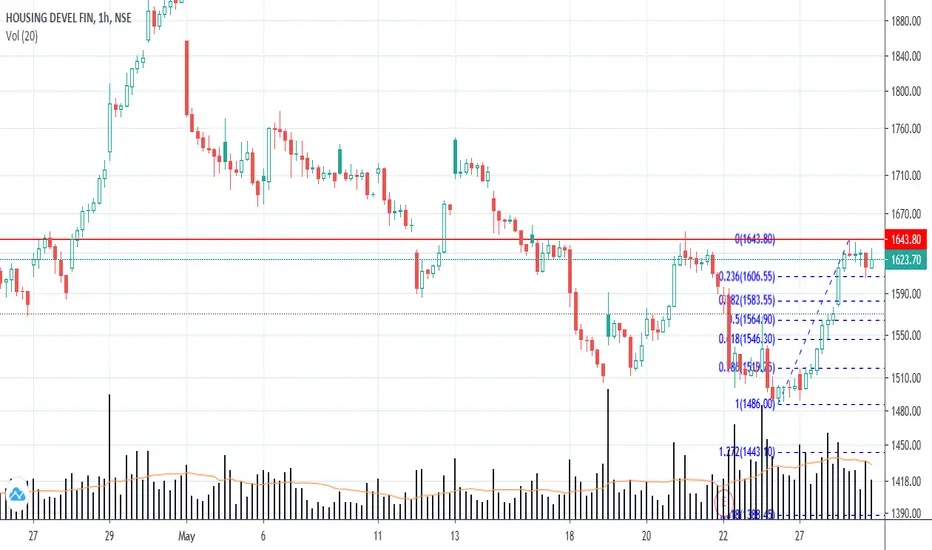
HDFC looking bearish on 1H chart.
In last trading session (28/05/2020) HDFC manage to make a high of 1643.8 which is a resistance level for HDFC you can clearly see the same on a 1H chart too.
After testing a resistance level prices are continuosly rejecting from higher levels which is also visible on last 5 candles of 1H chart.
HDFC already tested first Fib Retracement level of 1606 in trading session of 28/05/2020 and if in coming trading session any 1H candle manage to close below the same it will be good confirmation to go short in HDFC.
If any 1H candle of HDFC manage to close below 1606 then it will go for 1546 and 1519 which are the Fib Retracement levels of 0.618 and 0.786 respectively.
I will prefer to keep my stop loss at 1661 in HDFC
면책사항
해당 정보와 게시물은 금융, 투자, 트레이딩 또는 기타 유형의 조언이나 권장 사항으로 간주되지 않으며, 트레이딩뷰에서 제공하거나 보증하는 것이 아닙니다. 자세한 내용은 이용 약관을 참조하세요.
면책사항
해당 정보와 게시물은 금융, 투자, 트레이딩 또는 기타 유형의 조언이나 권장 사항으로 간주되지 않으며, 트레이딩뷰에서 제공하거나 보증하는 것이 아닙니다. 자세한 내용은 이용 약관을 참조하세요.