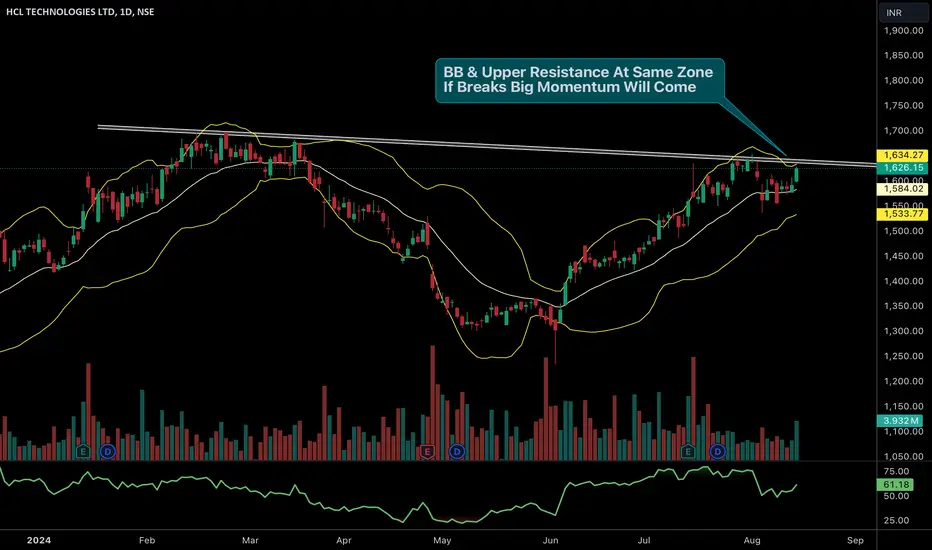
✅ HCL Tech has been consolidating near its upper resistance zone, where both the Bollinger Bands and trendline resistance align. This zone around ₹1630-1650 is crucial as a breakout above this level could trigger significant momentum.
✅ The stock is showing strength, moving along the upper Bollinger Band, which often precedes a breakout when combined with rising volumes.
✅ Watch for a breakout above the ₹1650 level. If the stock sustains above this zone, it could see a sharp upside move. However, failure to break this resistance may lead to a pullback towards the middle Bollinger Band and support around ₹1550-1600.
Join our community in telegram for real time updates --- telegram.me/marketiik
Telegram- telegram.me/marketiik
A simple trader, distancing from the fake crowd. Simplifying complexity, I prioritize genuine insights over trends.
Telegram- telegram.me/marketiik
A simple trader, distancing from the fake crowd. Simplifying complexity, I prioritize genuine insights over trends.
면책사항
해당 정보와 게시물은 금융, 투자, 트레이딩 또는 기타 유형의 조언이나 권장 사항으로 간주되지 않으며, 트레이딩뷰에서 제공하거나 보증하는 것이 아닙니다. 자세한 내용은 이용 약관을 참조하세요.