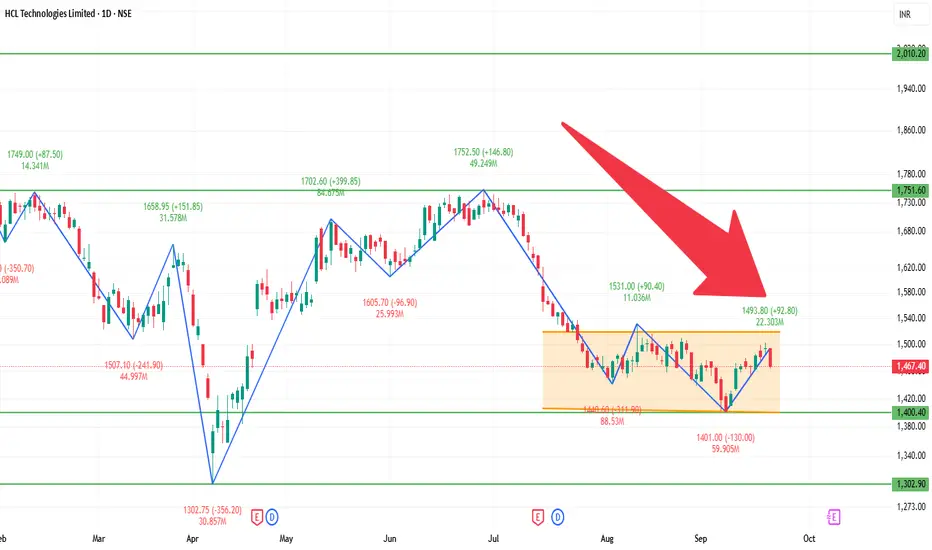
📊 Current Overview
Price is trading near ₹1,460 – ₹1,470 range.
Trend on the daily chart is showing weakness.
Stock is trading below most key moving averages (50-day, 100-day, 200-day).
🔍 Support & Resistance
Immediate Support: ₹1,450
Next Support: ₹1,430 – ₹1,420
Immediate Resistance: ₹1,470 – ₹1,475
Higher Resistance: ₹1,490 – ₹1,500
📈 Indicators
RSI (14): Neutral to slightly bearish, around mid-40s.
MACD: Weak, showing bearish crossover or flat momentum.
Trend: More sideways to bearish unless resistance levels break.
🎯 Possible Scenarios
Bullish: If HCLTECH breaks and sustains above ₹1,475, it could target ₹1,490 – ₹1,500.
Bearish: If it fails and slips below ₹1,450, it may fall towards ₹1,430 – ₹1,420.
관련 발행물
면책사항
해당 정보와 게시물은 금융, 투자, 트레이딩 또는 기타 유형의 조언이나 권장 사항으로 간주되지 않으며, 트레이딩뷰에서 제공하거나 보증하는 것이 아닙니다. 자세한 내용은 이용 약관을 참조하세요.
관련 발행물
면책사항
해당 정보와 게시물은 금융, 투자, 트레이딩 또는 기타 유형의 조언이나 권장 사항으로 간주되지 않으며, 트레이딩뷰에서 제공하거나 보증하는 것이 아닙니다. 자세한 내용은 이용 약관을 참조하세요.