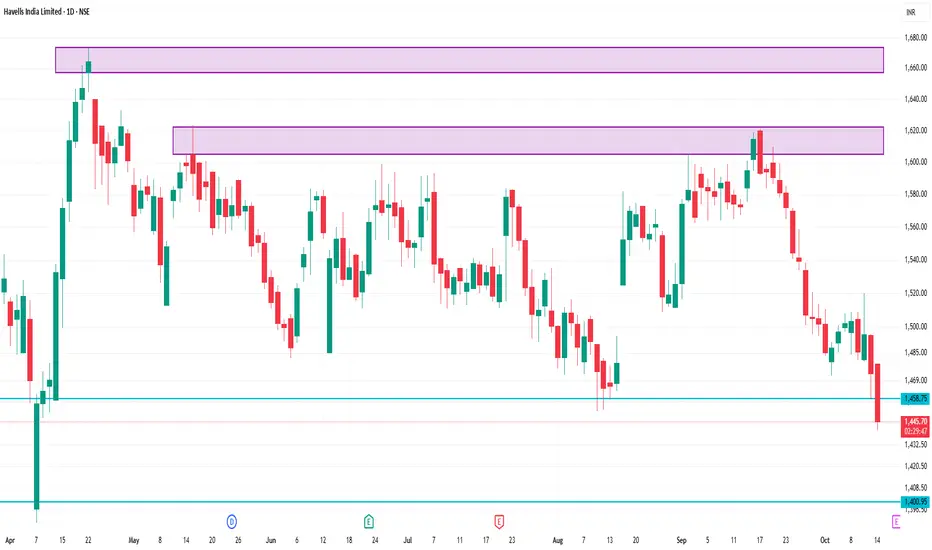
📊 Key Support and Resistance Levels
Immediate Support: ₹1,477.53
Immediate Resistance: ₹1,527.85
Short-Term Support: ₹1,497.04
Short-Term Resistance: ₹1,538.60
Fibonacci Pivot Point: ₹1,462.70
These levels are derived from standard technical analysis tools and are relevant for intraday trading strategies.
📉 Technical Indicators
Relative Strength Index (RSI): 28.62 (indicating an oversold condition)
Moving Average Convergence Divergence (MACD): -9.64 (suggesting bearish momentum)
5-Day Moving Average: ₹1,465.36
50-Day Moving Average: ₹1,490.21
200-Day Moving Average: ₹1,547.08
These indicators collectively suggest a bearish trend in the short term.
관련 발행물
면책사항
이 정보와 게시물은 TradingView에서 제공하거나 보증하는 금융, 투자, 거래 또는 기타 유형의 조언이나 권고 사항을 의미하거나 구성하지 않습니다. 자세한 내용은 이용 약관을 참고하세요.
관련 발행물
면책사항
이 정보와 게시물은 TradingView에서 제공하거나 보증하는 금융, 투자, 거래 또는 기타 유형의 조언이나 권고 사항을 의미하거나 구성하지 않습니다. 자세한 내용은 이용 약관을 참고하세요.