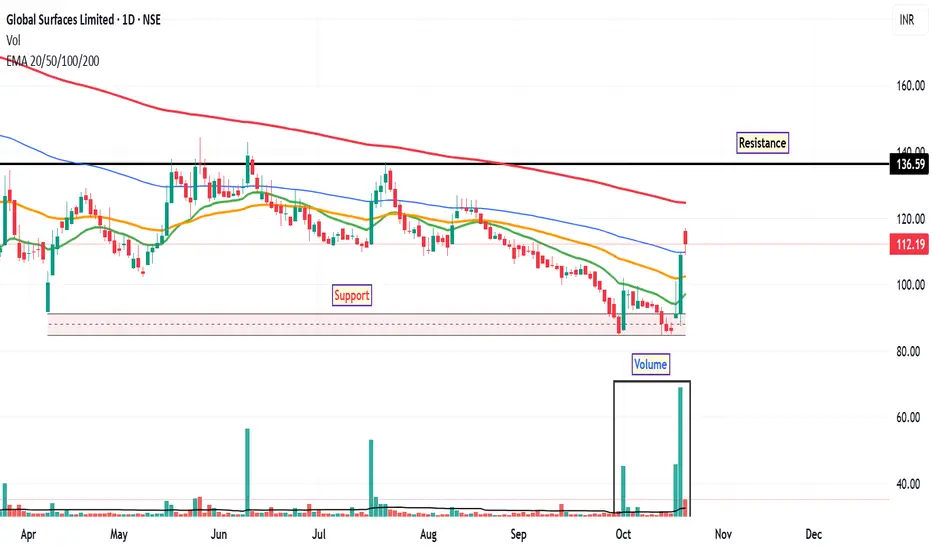
The stock of GSLSU has been in a sustained downtrend since May, revisiting its discount zone multiple times. However, recent price action suggests a possible shift in sentiment. On Friday, October 17, the daily chart printed an inverted hammer candlestick, a pattern often interpreted by technical analysts as a potential bullish reversal signal—especially when supported by volume and other indicators.
The inverted hammer on the daily timeframe may indicate buying interest at lower levels. This pattern gains significance when it appears after a prolonged downtrend and is accompanied by increased volume. The bullish signal is further supported by a rise in trading volume and a daily close above the 20-day, 50-day, and 100-day EMAs, suggesting short-term strength and potential trend reversal.
In the most recent trading session, the stock found support at the 100-day EMA and rebounded, reinforcing the validity of this level as a short-term base. The RSI has moved above 65, indicating increasing bullish momentum. This level is often seen as a sign of strengthening trend, though not yet in overbought territory.
If the stock sustains its upward movement, the next potential resistance level may be around ₹136, based on previous price action. The discount zone near ₹84 may serve as a key support level. Traders often monitor such zones for invalidation of bullish setups or potential re-entry points.
Disclaimer: This analysis is intended for educational and informational purposes only. It does not constitute investment advice or a recommendation to buy, sell, or hold any financial instrument. Market participants should conduct their own research and consult with a licensed financial advisor before making any investment decisions.
거래청산: 타겟 닿음
Price reached to Resistance, idea Closed.면책사항
해당 정보와 게시물은 금융, 투자, 트레이딩 또는 기타 유형의 조언이나 권장 사항으로 간주되지 않으며, 트레이딩뷰에서 제공하거나 보증하는 것이 아닙니다. 자세한 내용은 이용 약관을 참조하세요.
면책사항
해당 정보와 게시물은 금융, 투자, 트레이딩 또는 기타 유형의 조언이나 권장 사항으로 간주되지 않으며, 트레이딩뷰에서 제공하거나 보증하는 것이 아닙니다. 자세한 내용은 이용 약관을 참조하세요.