GSFC chart showing a hidden setup… Is this the breakout moment?
GSFC Chart Update (4H Timeframe)
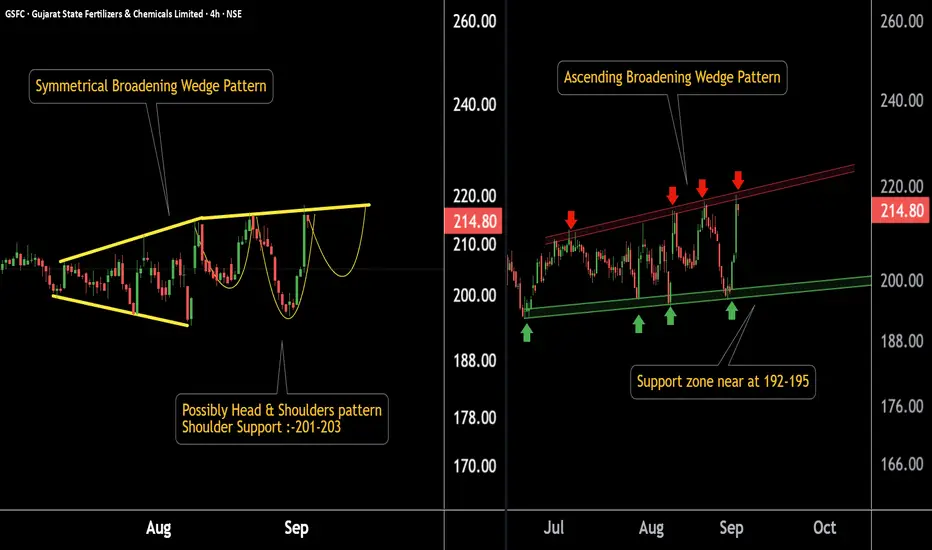
Chart 1:
Stock has formed a symmetrical broadening wedge.
If the stock respects the resistance, there is a possibility of a Head & Shoulders pattern.
Key support zone: 202 – 204.
Chart 2:
GSFC is forming an ascending broadening wedge pattern.
Support lies in the 192 – 195 range.
If this level sustains, potential pattern target is around 240.
Thank You !!
@RahulSaraoge
Connect us at t.me/stridesadvisory
Connect us at t.me/stridesadvisory
면책사항
해당 정보와 게시물은 금융, 투자, 트레이딩 또는 기타 유형의 조언이나 권장 사항으로 간주되지 않으며, 트레이딩뷰에서 제공하거나 보증하는 것이 아닙니다. 자세한 내용은 이용 약관을 참조하세요.
@RahulSaraoge
Connect us at t.me/stridesadvisory
Connect us at t.me/stridesadvisory
면책사항
해당 정보와 게시물은 금융, 투자, 트레이딩 또는 기타 유형의 조언이나 권장 사항으로 간주되지 않으며, 트레이딩뷰에서 제공하거나 보증하는 것이 아닙니다. 자세한 내용은 이용 약관을 참조하세요.