GAP resistance again
Blue line from the highest high and down trending
[the recent high breaking this trend all QE ? ]
channels are resistance zones from gaps and hi/low peaks [ R&S}
[ hate i can not see chart while making comments ! ]
seeing if secondary resistance lines are S&R - noticing gaps in these channels occasionally
노트
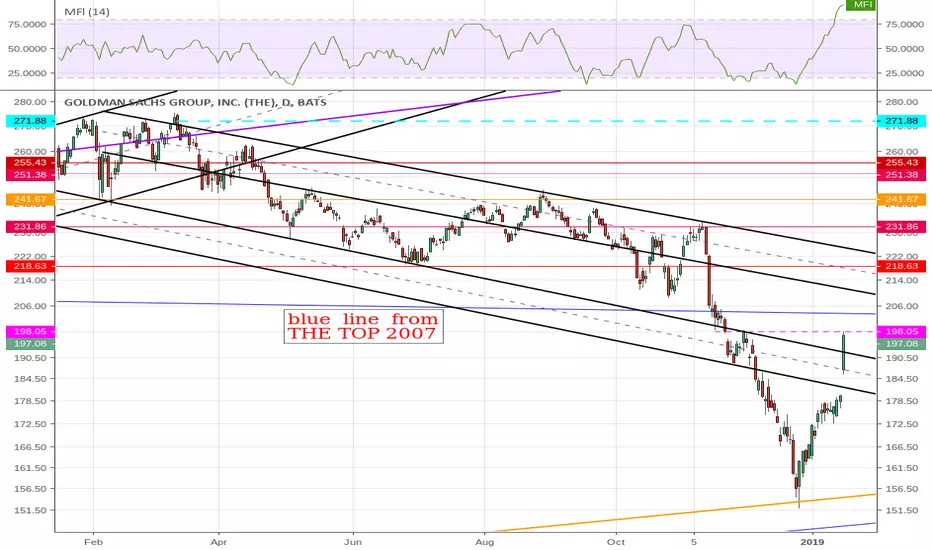
the blue line which is the top from 10/15/2007 and
down-trending from 6/1/2015
below 5/2017 bottom
seems to be a resistance here
waiting to see what happens when we get to down trend black channel
면책사항
해당 정보와 게시물은 금융, 투자, 트레이딩 또는 기타 유형의 조언이나 권장 사항으로 간주되지 않으며, 트레이딩뷰에서 제공하거나 보증하는 것이 아닙니다. 자세한 내용은 이용 약관을 참조하세요.
면책사항
해당 정보와 게시물은 금융, 투자, 트레이딩 또는 기타 유형의 조언이나 권장 사항으로 간주되지 않으며, 트레이딩뷰에서 제공하거나 보증하는 것이 아닙니다. 자세한 내용은 이용 약관을 참조하세요.