The Graph (GRT) Token Market Status

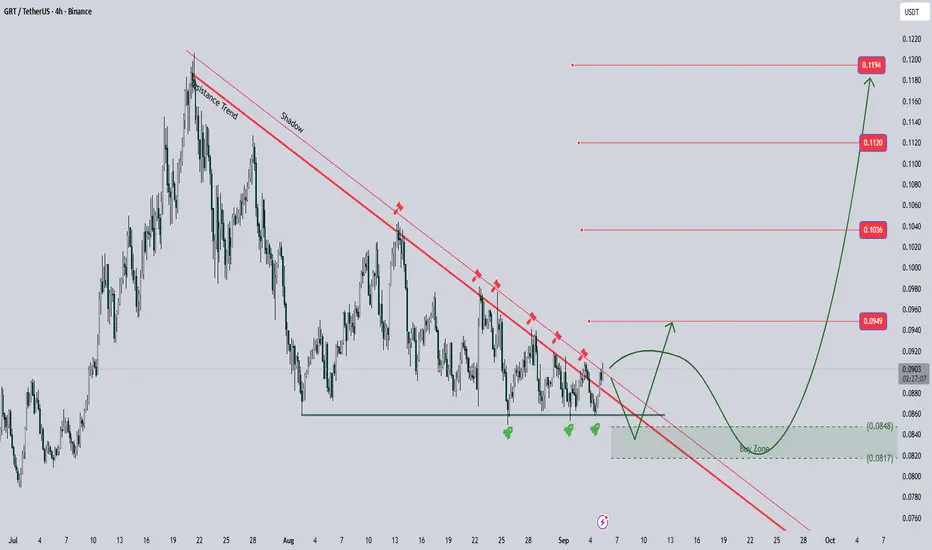
 GRTUSDT is in a downtrend that has been weakening over the past few days. It has found strong support in the price range of $0.0850 - $0.0860. Each time this support holds, it leads to an upward movement toward the downtrend line, where we've seen several fake breakouts.
It's highly probable that the downtrend line will break to the upside, but there are two possible scenarios:
Scenario 1:
A fake breakout to the upside followed by a return to the support line, then a fake breakout of the support line itself, and finally an upward move. In this scenario, the green box would be our buy zone.
Scenario 2:
The downtrend line breaks to the upside with strong momentum today or tomorrow, and then retests the green box, which would again be our buy zone.
In both scenarios, the green box is my designated buy zone, and all major pivots could be potential price targets.
⛔ This is not financial advice; do your own research.
면책사항
이 정보와 게시물은 TradingView에서 제공하거나 보증하는 금융, 투자, 거래 또는 기타 유형의 조언이나 권고 사항을 의미하거나 구성하지 않습니다. 자세한 내용은 이용 약관을 참고하세요.
면책사항
이 정보와 게시물은 TradingView에서 제공하거나 보증하는 금융, 투자, 거래 또는 기타 유형의 조언이나 권고 사항을 의미하거나 구성하지 않습니다. 자세한 내용은 이용 약관을 참고하세요.