The “M” Pattern: A Swing Trading vs. Wave Trading Perspective
Swing Trading View
In swing trading, the M pattern is a widely recognized and frequently traded formation. It typically signals a potential trend reversal and is considered the opposite of the W pattern, which indicates bullish setups.
The M pattern presents two main trading opportunities for swing traders:
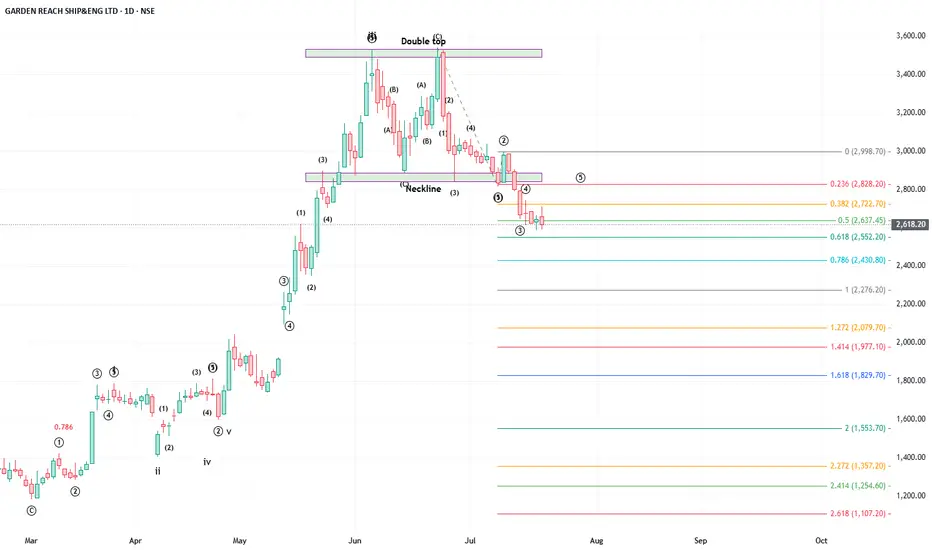
Short at the Double Top:
When the price forms a double top, traders often enter a short position targeting the neckline as the profit zone. This setup banks on the failure of the price to break previous highs, indicating exhaustion in bullish momentum.
Long at the Neckline Bounce:
If the price reaches the neckline and bounces upwards, traders may initiate a long position, aiming for the previous swing high. This move anticipates a potential failed breakdown or a continuation of the broader trend.
In both cases, trailing stop-losses can be employed to ride the trade further if momentum continues. However, swing traders must rely on discretion and market context to decide when to exit, as there's no deeper structural guide beyond the pattern.
Wave Trading View
From an Elliott Wave perspective, patterns resembling the letter “M” often arise during a Flat correction, one of the three core corrective structures—Zigzag, Flat, and Triangle.
Flat corrections unfold in a 3-3-5 wave structure, labeled as waves A-B-C:
In a bullish market correction,
Wave A: Downward move (3 waves)
Wave B: Upward retracement (3 waves)
Wave C: Final downward move (5 waves)
Flats occur in three variations:
Regular Flat: Waves A and B are nearly equal in length, with Wave C slightly longer.
Expanded (Extended) Flat: Wave B travels beyond the start of Wave A, often reaching up to 1.33x Wave A. If Wave B exceeds 1.33x, it is no longer considered a valid flat.
Running Flat: Wave C does not surpass the end of Wave A, creating a skewed M-like shape.
In this structure:
The “M” appearance is most prominent when plotted visually, especially in regular or extended flats (as found in the accompanied chart of GRSE).
The unique edge for a wave trader lies in contextual awareness—knowing where flats are likely to form based on the wave formation.
Unlike swing traders who trade patterns in isolation, wave traders operate within a broader map, allowing them to:
Anticipate the pattern in advance
Position precisely within the structure
Manage trades with greater confidence based on Fibonacci relationships and wave counts
Wave C is particularly important:
It must consist of 5 sub-waves. Its minimum length should be equal to the distance from the start of Wave A to the end of Wave B. Even if this ratio is only marginally exceeded, the presence of a clear 5-wave subdivision confirms the end of the correction, subject to end of sub-wave 5.
In essence, while both swing and wave traders may trade the same “M” pattern, the wave trader approaches it with far deeper context, structure, and predictive insight—enabling more precise and confident trading decisions.
In swing trading, the M pattern is a widely recognized and frequently traded formation. It typically signals a potential trend reversal and is considered the opposite of the W pattern, which indicates bullish setups.
The M pattern presents two main trading opportunities for swing traders:
Short at the Double Top:
When the price forms a double top, traders often enter a short position targeting the neckline as the profit zone. This setup banks on the failure of the price to break previous highs, indicating exhaustion in bullish momentum.
Long at the Neckline Bounce:
If the price reaches the neckline and bounces upwards, traders may initiate a long position, aiming for the previous swing high. This move anticipates a potential failed breakdown or a continuation of the broader trend.
In both cases, trailing stop-losses can be employed to ride the trade further if momentum continues. However, swing traders must rely on discretion and market context to decide when to exit, as there's no deeper structural guide beyond the pattern.
Wave Trading View
From an Elliott Wave perspective, patterns resembling the letter “M” often arise during a Flat correction, one of the three core corrective structures—Zigzag, Flat, and Triangle.
Flat corrections unfold in a 3-3-5 wave structure, labeled as waves A-B-C:
In a bullish market correction,
Wave A: Downward move (3 waves)
Wave B: Upward retracement (3 waves)
Wave C: Final downward move (5 waves)
Flats occur in three variations:
Regular Flat: Waves A and B are nearly equal in length, with Wave C slightly longer.
Expanded (Extended) Flat: Wave B travels beyond the start of Wave A, often reaching up to 1.33x Wave A. If Wave B exceeds 1.33x, it is no longer considered a valid flat.
Running Flat: Wave C does not surpass the end of Wave A, creating a skewed M-like shape.
In this structure:
The “M” appearance is most prominent when plotted visually, especially in regular or extended flats (as found in the accompanied chart of GRSE).
The unique edge for a wave trader lies in contextual awareness—knowing where flats are likely to form based on the wave formation.
Unlike swing traders who trade patterns in isolation, wave traders operate within a broader map, allowing them to:
Anticipate the pattern in advance
Position precisely within the structure
Manage trades with greater confidence based on Fibonacci relationships and wave counts
Wave C is particularly important:
It must consist of 5 sub-waves. Its minimum length should be equal to the distance from the start of Wave A to the end of Wave B. Even if this ratio is only marginally exceeded, the presence of a clear 5-wave subdivision confirms the end of the correction, subject to end of sub-wave 5.
In essence, while both swing and wave traders may trade the same “M” pattern, the wave trader approaches it with far deeper context, structure, and predictive insight—enabling more precise and confident trading decisions.
ChartTheWave |
t.me/chartthewave
This channel is a common forum for "Elliott Wave Principle" enthusiasts, learners and practitioners. We aim to build a team of traders who practice EWP for common benefit; co-learn, teach, share, validate and benefit.
t.me/chartthewave
This channel is a common forum for "Elliott Wave Principle" enthusiasts, learners and practitioners. We aim to build a team of traders who practice EWP for common benefit; co-learn, teach, share, validate and benefit.
면책사항
해당 정보와 게시물은 금융, 투자, 트레이딩 또는 기타 유형의 조언이나 권장 사항으로 간주되지 않으며, 트레이딩뷰에서 제공하거나 보증하는 것이 아닙니다. 자세한 내용은 이용 약관을 참조하세요.