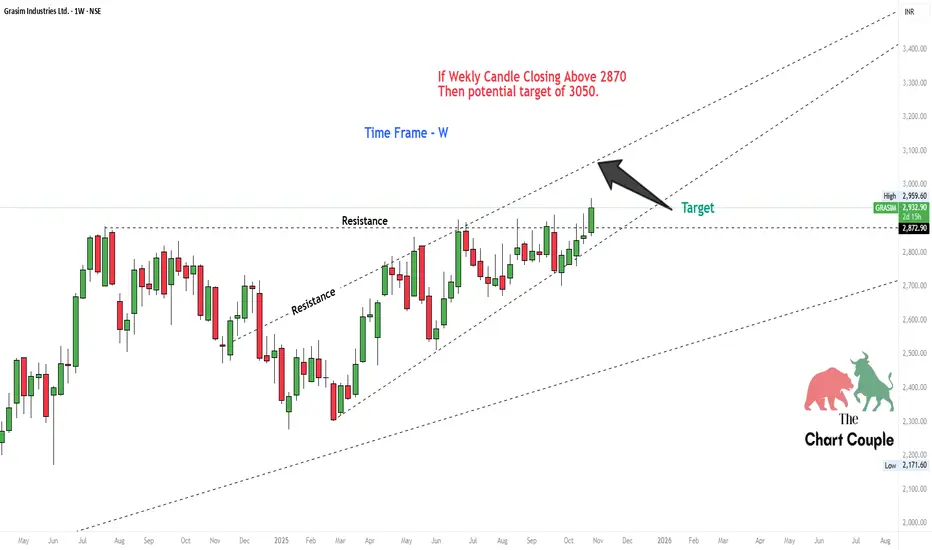
The stock is showing strong momentum within its rising channel!
📈 Key Level to Watch:
If the weekly candle closes above 2870, it could open the gates toward a potential target of 3050.
🧠 Technical View:
Price breaking past resistance zone
Volume confirmation could add strength
Trend remains bullish within channel
⚠️ Keep an eye on the weekly close — a confirmed breakout can bring solid upside momentum!
💬 What’s your view on GRASIM’s next move — breakout or pullback?
#grasim #technicalanalysis #stockmarketindia #nifty50 #priceactiontrading #thechartcouple #indianstocks #chartanalysis #stockbreakout #tradingview #swingtrading #marketanalysis
면책사항
해당 정보와 게시물은 금융, 투자, 트레이딩 또는 기타 유형의 조언이나 권장 사항으로 간주되지 않으며, 트레이딩뷰에서 제공하거나 보증하는 것이 아닙니다. 자세한 내용은 이용 약관을 참조하세요.
면책사항
해당 정보와 게시물은 금융, 투자, 트레이딩 또는 기타 유형의 조언이나 권장 사항으로 간주되지 않으며, 트레이딩뷰에서 제공하거나 보증하는 것이 아닙니다. 자세한 내용은 이용 약관을 참조하세요.