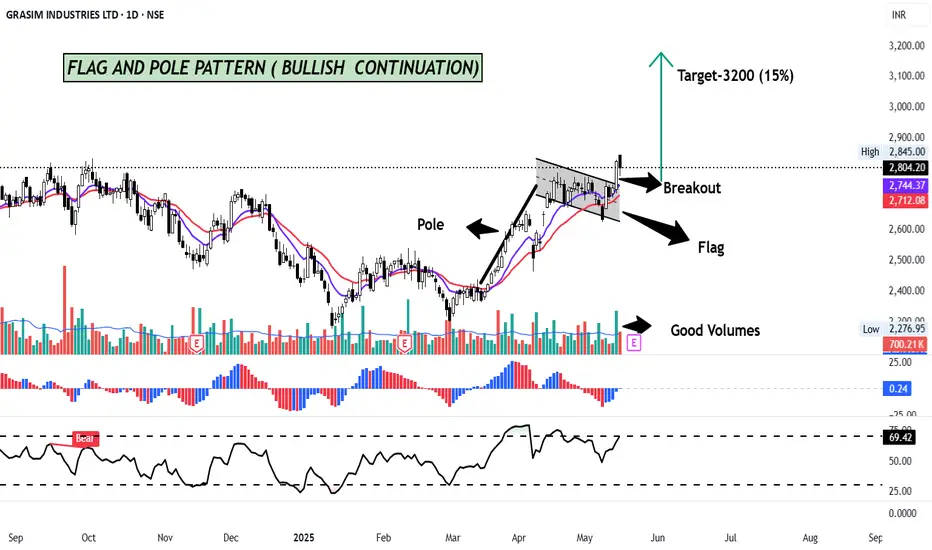
GRASIM has formed a FLAG AND POLE pattern on the Daily charts and has given a breakout with good volume.
The "flag and pole pattern" in technical analysis is a chart pattern that signals a potential continuation of an existing trend. It's characterized by a sharp, initial price movement (the "pole") followed by a period of consolidation (the "flag") within a defined range. A breakout from this range, in the same direction as the initial pole, suggests a likely continuation of the original trend
The target of this pattern signals an upside potential of 15% from the current price level in medium term.
Stock is trading above its 11 & 22 day EMA. RSI is at 69, signalling positive momentum.
CMP- Rs. 2804
Target Price- Rs 3200 ( 15% upside)
SL - 2704
Disclaimer: This is not a buy/sell recommendation. For educational purpose only. Kindly consult your financial advisor before entering a trade.
면책사항
해당 정보와 게시물은 금융, 투자, 트레이딩 또는 기타 유형의 조언이나 권장 사항으로 간주되지 않으며, 트레이딩뷰에서 제공하거나 보증하는 것이 아닙니다. 자세한 내용은 이용 약관을 참조하세요.
면책사항
해당 정보와 게시물은 금융, 투자, 트레이딩 또는 기타 유형의 조언이나 권장 사항으로 간주되지 않으며, 트레이딩뷰에서 제공하거나 보증하는 것이 아닙니다. 자세한 내용은 이용 약관을 참조하세요.