📊 Support & Resistance Levels
Classic Pivot Points:
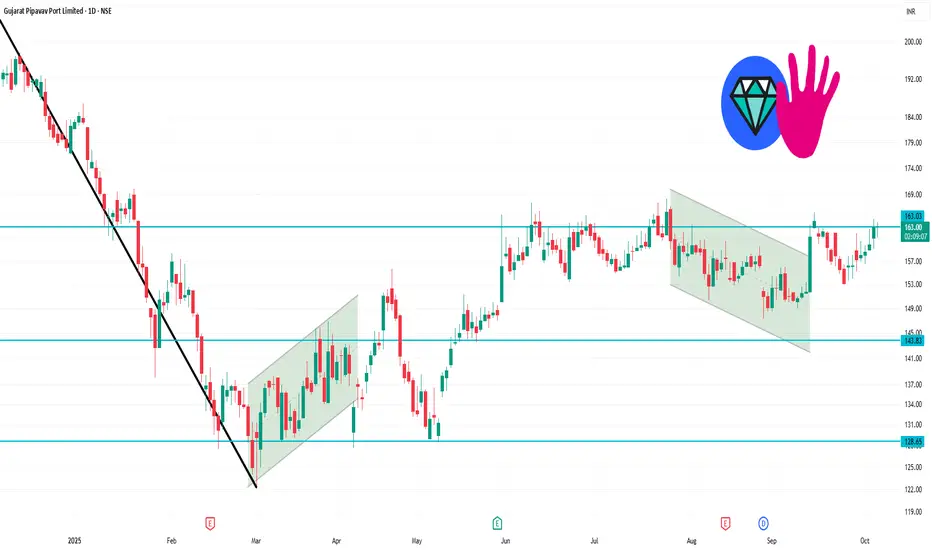
Support (S1): ₹156.60
Resistance (R1): ₹163.20
Pivot Point (PP): ₹158.45
Fibonacci Levels:
Support: ₹157.19 (50% retracement)
Resistance: ₹160.49 (61.8% retracement)
Camarilla Levels:
Support (S1): ₹161.58
Resistance (R1): ₹164.56
These levels are calculated based on the previous day's high, low, and close prices.
Top Stock Research
📈 Technical Indicators
Relative Strength Index (RSI): 58.6 — Indicates a neutral stance, neither overbought nor oversold.
Moving Average Convergence Divergence (MACD): 1.04 — Suggests a buy signal, indicating potential bullish momentum.
Average Directional Index (ADX): 13.98 — Reflects a weak trend, suggesting indecision in the market.
Commodity Channel Index (CCI): 75.98 — Neutral, showing no strong trend direction.
Rate of Change (ROC): -0.84 — Indicates a slight bearish momentum.
Classic Pivot Points:
Support (S1): ₹156.60
Resistance (R1): ₹163.20
Pivot Point (PP): ₹158.45
Fibonacci Levels:
Support: ₹157.19 (50% retracement)
Resistance: ₹160.49 (61.8% retracement)
Camarilla Levels:
Support (S1): ₹161.58
Resistance (R1): ₹164.56
These levels are calculated based on the previous day's high, low, and close prices.
Top Stock Research
📈 Technical Indicators
Relative Strength Index (RSI): 58.6 — Indicates a neutral stance, neither overbought nor oversold.
Moving Average Convergence Divergence (MACD): 1.04 — Suggests a buy signal, indicating potential bullish momentum.
Average Directional Index (ADX): 13.98 — Reflects a weak trend, suggesting indecision in the market.
Commodity Channel Index (CCI): 75.98 — Neutral, showing no strong trend direction.
Rate of Change (ROC): -0.84 — Indicates a slight bearish momentum.
관련 발행물
면책사항
해당 정보와 게시물은 금융, 투자, 트레이딩 또는 기타 유형의 조언이나 권장 사항으로 간주되지 않으며, 트레이딩뷰에서 제공하거나 보증하는 것이 아닙니다. 자세한 내용은 이용 약관을 참조하세요.
관련 발행물
면책사항
해당 정보와 게시물은 금융, 투자, 트레이딩 또는 기타 유형의 조언이나 권장 사항으로 간주되지 않으며, 트레이딩뷰에서 제공하거나 보증하는 것이 아닙니다. 자세한 내용은 이용 약관을 참조하세요.