Hello TradingView Community,
This post outlines a potential long trade setup for Alphabet Inc (GOOGL) on the 15-minute chart.
Technical Analysis:
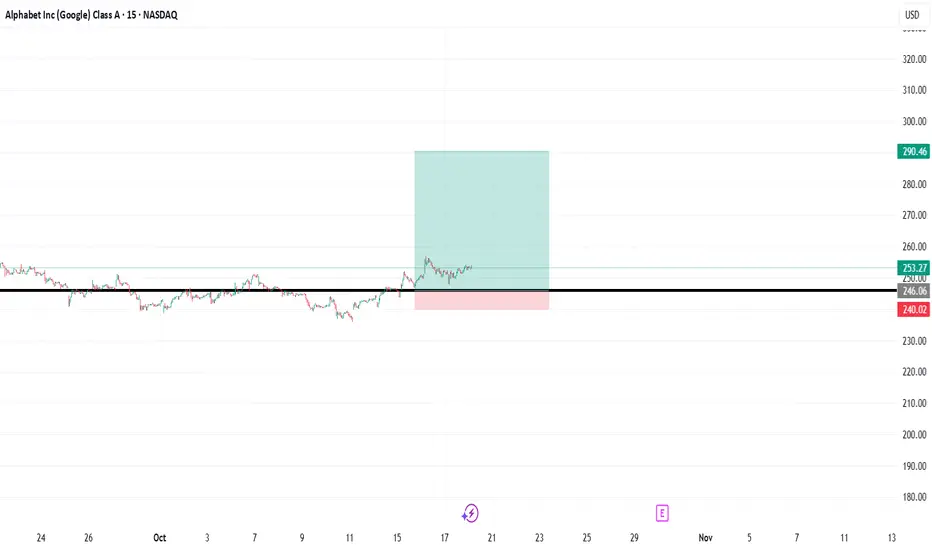
The chart highlights a key horizontal price level at approximately $246.06. This level previously acted as a significant resistance, capping the price on multiple occasions and creating a ceiling for the stock.
We have recently seen a clear breakout above this resistance, which is a bullish signal indicating that buyers are taking control. The trading idea is based on the classic "resistance-turned-support" principle. The price is currently consolidating above this broken level, which is now expected to act as a new support floor. A successful hold of this area would suggest a continuation of the uptrend.
Trade Setup:
The long position tool on the chart visualizes the specific plan for this bullish scenario:
Entry: Approximately $246.06 (at the retest of the new support).
Stop Loss: $240.02 (placed below the key support structure to invalidate the idea if the level fails to hold).
Take Profit: $290.46 (targeting a new potential higher high).
This setup provides a structured plan with a favorable risk-to-reward ratio for a potential continuation of the bullish move.
Disclaimer: This analysis is for educational and discussion purposes only and should not be considered as financial advice. Trading stocks involves significant risk. Please conduct your own research and manage your risk appropriately before making any trading decisions.
This post outlines a potential long trade setup for Alphabet Inc (GOOGL) on the 15-minute chart.
Technical Analysis:
The chart highlights a key horizontal price level at approximately $246.06. This level previously acted as a significant resistance, capping the price on multiple occasions and creating a ceiling for the stock.
We have recently seen a clear breakout above this resistance, which is a bullish signal indicating that buyers are taking control. The trading idea is based on the classic "resistance-turned-support" principle. The price is currently consolidating above this broken level, which is now expected to act as a new support floor. A successful hold of this area would suggest a continuation of the uptrend.
Trade Setup:
The long position tool on the chart visualizes the specific plan for this bullish scenario:
Entry: Approximately $246.06 (at the retest of the new support).
Stop Loss: $240.02 (placed below the key support structure to invalidate the idea if the level fails to hold).
Take Profit: $290.46 (targeting a new potential higher high).
This setup provides a structured plan with a favorable risk-to-reward ratio for a potential continuation of the bullish move.
Disclaimer: This analysis is for educational and discussion purposes only and should not be considered as financial advice. Trading stocks involves significant risk. Please conduct your own research and manage your risk appropriately before making any trading decisions.
면책사항
해당 정보와 게시물은 금융, 투자, 트레이딩 또는 기타 유형의 조언이나 권장 사항으로 간주되지 않으며, 트레이딩뷰에서 제공하거나 보증하는 것이 아닙니다. 자세한 내용은 이용 약관을 참조하세요.
면책사항
해당 정보와 게시물은 금융, 투자, 트레이딩 또는 기타 유형의 조언이나 권장 사항으로 간주되지 않으며, 트레이딩뷰에서 제공하거나 보증하는 것이 아닙니다. 자세한 내용은 이용 약관을 참조하세요.