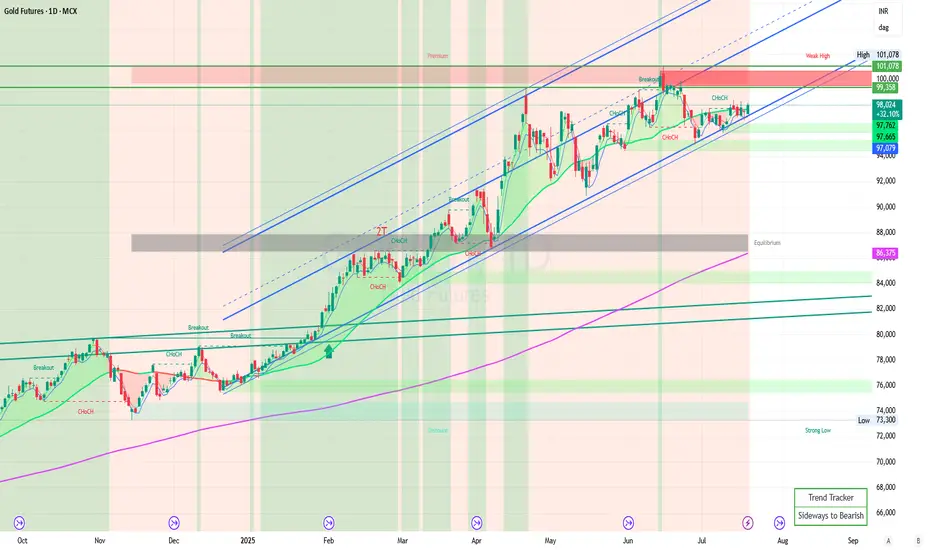
A gold daily time frame chart with an ascending channel is a technical analysis setup that shows the price movement of gold over a daily period, forming a pattern known as an ascending channel.
Key Features of an Ascending Channel:
- Trendline Connection: The channel is created by drawing two parallel trendlines:
- Lower Support Line: Connects the series of higher lows.
- Upper Resistance Line: Connects the series of higher highs.
- Price Action: The price of gold is moving upward within these two lines, bouncing between support and resistance.
- Trend Indication: Indicates a bullish trend, suggesting that the price is gradually increasing over time.
**Interpreting the Chart:
- Bullish Signal: As long as the price remains within the channel, the upward trend is considered intact.
- Trade Opportunities:
- Buy near support: When the price approaches the lower trendline.
- Sell near resistance: When the price nears the upper trendline.
- Breakouts:
- A move above the upper resistance line may signal strong bullish momentum.
- A break below the support line could indicate a trend reversal or correction.
Practical Use:
- Traders look for buying opportunities at the channel's support and be cautious if the price breaks out of the channel.
- Confirming other indicators or volume analysis can strengthen trading decisions.
Falgun Prajapati
면책사항
이 정보와 게시물은 TradingView에서 제공하거나 보증하는 금융, 투자, 거래 또는 기타 유형의 조언이나 권고 사항을 의미하거나 구성하지 않습니다. 자세한 내용은 이용 약관을 참고하세요.
Falgun Prajapati
면책사항
이 정보와 게시물은 TradingView에서 제공하거나 보증하는 금융, 투자, 거래 또는 기타 유형의 조언이나 권고 사항을 의미하거나 구성하지 않습니다. 자세한 내용은 이용 약관을 참고하세요.