Bullish Pennant Breakout in Gold MCX
📊 Pattern Overview:
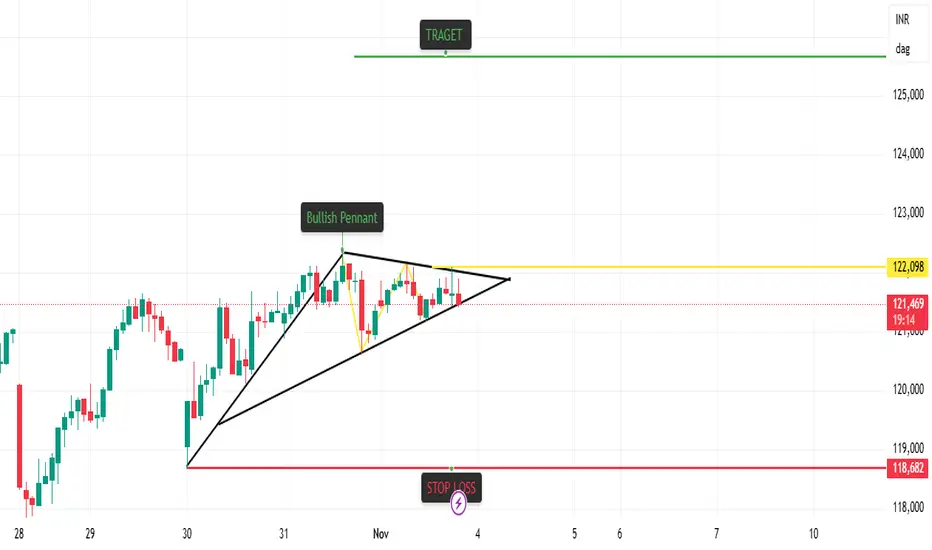
A Bullish Pennant pattern has formed after a strong upward move, signaling a potential continuation of the trend. The pattern is characterized by converging trendlines during consolidation, followed by a breakout to the upside.
📈 Strategy Setup:
Pattern: Bullish Pennant
Breakout Confirmation: Price closing above pennant resistance line
Entry Zone: Near breakout candle close
Target (T1): ₹125,635
Stop Loss (SL): ₹118,682
Risk–Reward Ratio: Approximately 1:2
📊 Indicator Confluence:
T-K Cross: Bullish Cross
Price vs Kijun: Bullish
Cloud Trend: Up
VWMA: Up
RSI: Up
VWAP: Up
SuperTrend: Down (short-term resistance, to be monitored)
🧠 Trading Logic:
The Bullish Pennant indicates a temporary consolidation within an existing uptrend. A confirmed breakout with indicator support (Ichimoku, RSI, VWMA, and VWAP in alignment) strengthens the bullish momentum. Traders may look for sustained candles above the upper trendline with volume confirmation.
⚠️ Disclaimer:
This content is shared for educational purposes only and does not constitute investment or trading advice. Market conditions can change rapidly — always conduct your own analysis and use proper risk management before making any trading decisions.
📊 Pattern Overview:
A Bullish Pennant pattern has formed after a strong upward move, signaling a potential continuation of the trend. The pattern is characterized by converging trendlines during consolidation, followed by a breakout to the upside.
📈 Strategy Setup:
Pattern: Bullish Pennant
Breakout Confirmation: Price closing above pennant resistance line
Entry Zone: Near breakout candle close
Target (T1): ₹125,635
Stop Loss (SL): ₹118,682
Risk–Reward Ratio: Approximately 1:2
📊 Indicator Confluence:
T-K Cross: Bullish Cross
Price vs Kijun: Bullish
Cloud Trend: Up
VWMA: Up
RSI: Up
VWAP: Up
SuperTrend: Down (short-term resistance, to be monitored)
🧠 Trading Logic:
The Bullish Pennant indicates a temporary consolidation within an existing uptrend. A confirmed breakout with indicator support (Ichimoku, RSI, VWMA, and VWAP in alignment) strengthens the bullish momentum. Traders may look for sustained candles above the upper trendline with volume confirmation.
⚠️ Disclaimer:
This content is shared for educational purposes only and does not constitute investment or trading advice. Market conditions can change rapidly — always conduct your own analysis and use proper risk management before making any trading decisions.
면책사항
이 정보와 게시물은 TradingView에서 제공하거나 보증하는 금융, 투자, 거래 또는 기타 유형의 조언이나 권고 사항을 의미하거나 구성하지 않습니다. 자세한 내용은 이용 약관을 참고하세요.
면책사항
이 정보와 게시물은 TradingView에서 제공하거나 보증하는 금융, 투자, 거래 또는 기타 유형의 조언이나 권고 사항을 의미하거나 구성하지 않습니다. 자세한 내용은 이용 약관을 참고하세요.