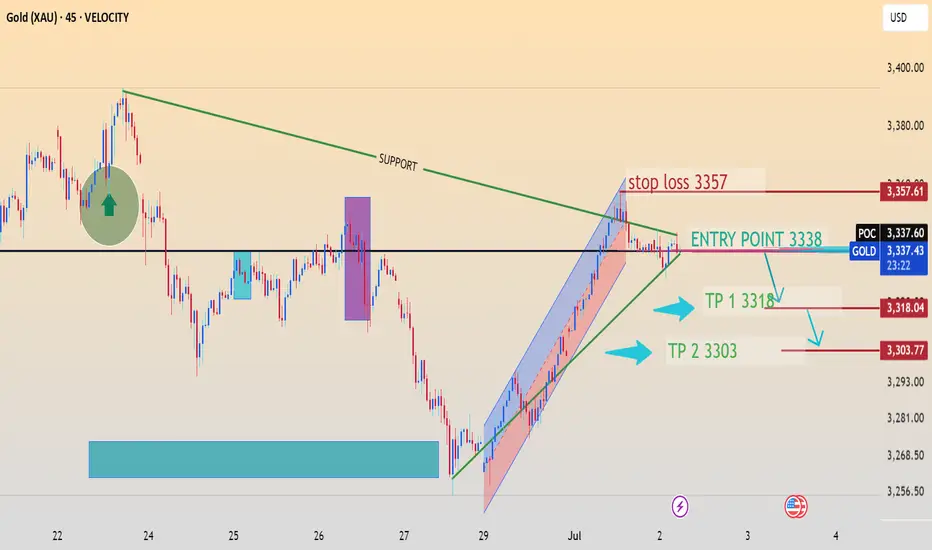
This chart presents a Gold (XAUUSD) trading setup on the 45-minute timeframe, with a clear short (sell) bias. Here’s a breakdown of the key elements and strategy indicated:
---
📉 Trade Setup Summary:
Entry Point: 3338
Stop Loss: 3357 (just above the recent high)
Take Profit 1 (TP1): 3318
Take Profit 2 (TP2): 3303
---
📊 Technical Analysis Highlights:
Descending Resistance (Green Trendline): The price is respecting a long-term downward sloping resistance line labeled "SUPPORT" (probably meant to be resistance).
Rising Channel Break: The price has broken out of a short-term ascending channel, suggesting weakening bullish momentum.
POC (Point of Control) @ 3337.60: Indicates a high-volume price level, often acting as a pivot or resistance.
Bearish Rejection at Resistance: Price failed to hold above the descending resistance, reinforcing short-term bearish bias.
---
🧠 Trade Logic:
The entry is just below a key resistance/POC level.
The stop loss is well-placed above the resistance to allow for minor fluctuations.
The two targets (TP1 and TP2) correspond with previous minor support areas and Fibonacci retracement zones.
---
⚠ Considerations:
Watch for price action confirmation below 3338 to validate the breakdown.
If price reclaims the 3345–3357 zone with strong volume, it may invalidate this setup.
Always use proper risk management (e.g., risk/reward ratio ≥ 1:2).
---
---
📉 Trade Setup Summary:
Entry Point: 3338
Stop Loss: 3357 (just above the recent high)
Take Profit 1 (TP1): 3318
Take Profit 2 (TP2): 3303
---
📊 Technical Analysis Highlights:
Descending Resistance (Green Trendline): The price is respecting a long-term downward sloping resistance line labeled "SUPPORT" (probably meant to be resistance).
Rising Channel Break: The price has broken out of a short-term ascending channel, suggesting weakening bullish momentum.
POC (Point of Control) @ 3337.60: Indicates a high-volume price level, often acting as a pivot or resistance.
Bearish Rejection at Resistance: Price failed to hold above the descending resistance, reinforcing short-term bearish bias.
---
🧠 Trade Logic:
The entry is just below a key resistance/POC level.
The stop loss is well-placed above the resistance to allow for minor fluctuations.
The two targets (TP1 and TP2) correspond with previous minor support areas and Fibonacci retracement zones.
---
⚠ Considerations:
Watch for price action confirmation below 3338 to validate the breakdown.
If price reclaims the 3345–3357 zone with strong volume, it may invalidate this setup.
Always use proper risk management (e.g., risk/reward ratio ≥ 1:2).
---
면책사항
이 정보와 게시물은 TradingView에서 제공하거나 보증하는 금융, 투자, 거래 또는 기타 유형의 조언이나 권고 사항을 의미하거나 구성하지 않습니다. 자세한 내용은 이용 약관을 참고하세요.
면책사항
이 정보와 게시물은 TradingView에서 제공하거나 보증하는 금융, 투자, 거래 또는 기타 유형의 조언이나 권고 사항을 의미하거나 구성하지 않습니다. 자세한 내용은 이용 약관을 참고하세요.