Technical Analysis - Gold (XAU/USD) - 1H Timeframe
🔹 Market Structure Overview
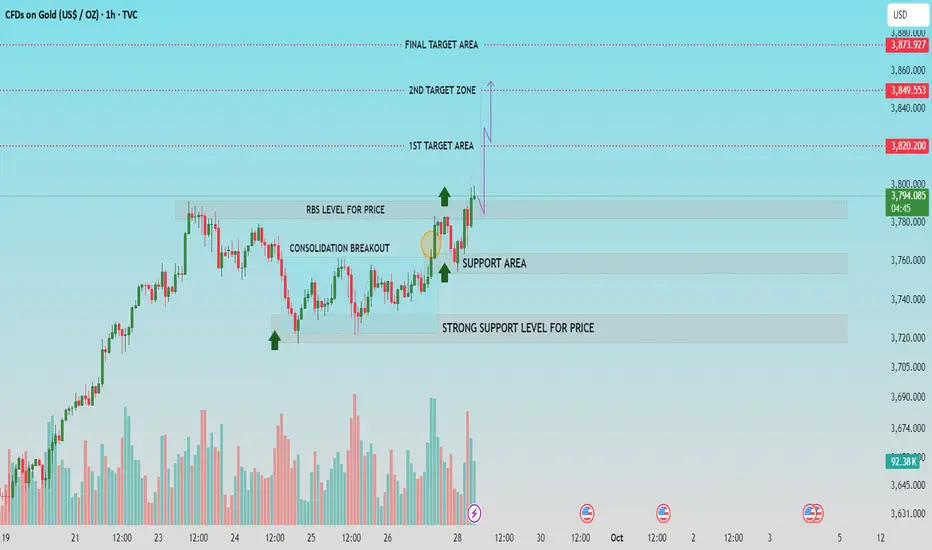
Gold has resumed its upward trend after a consolidation breakout, as shown in the middle of the chart. The breakout is supported by increased bullish volume, indicating strong buying interest.
Price is currently trading at $3,796, moving towards the defined target zones, with a clean bullish structure of higher highs and higher lows.
🔍 Key Technical Levels
🔼 Resistance & Target Zones:
▪1st Target Area: $3,820
▫Closely aligned with previous short-term resistance. A minor consolidation may occur here before continuation.
▪2nd Target Zone: $3,850
▫A more significant resistance level, where sellers may re-enter. Monitor for reversal patterns or a breakout confirmation.
▪Final Target Area: $3,873 - $3,880
* Represents a potential exhaustion point for the current bullish leg. Price action here will determine if a larger breakout or retracement follows.
🟩 Support Levels:
▪RBS Level (Resistance Becomes Support): Around $3,780
▫Price has flipped this level into support after breaking above - a classic retest confirming strength.
▪Support Area: $3,760 - $3,780
▫Recent bullish reactions from this area make it a short-term demand zone.
▪Strong Support Level: $3,720
▫ Historically significant level with multiple bounce points. A break below this would invalidate the current bullish setup.
📊 Volume Analysis
▫ Notable volume spike occurred at the breakout point of the consolidation range (highlighted circle), validating bullish momentum.
▫Sustained volume during the upward move suggests strong institutional interest.
📈 Price Action Insights
▪ Consolidation Breakout: After a period of sideways movement, price broke above the consolidation range, suggesting accumulation and a bullish continuation.
▪Bullish Retest: The market performed a clean retest of the breakout zone, confirming buyer control.
▪Steady Climb: No major rejection wicks or bearish engulfing candles observed - market sentiment remains positive.
🔄 Projected Price Movement
The purple projection arrow shows an expected bullish continuation toward:
1. $3,820 (1st Target)
2. $3,850 (2nd Target)
3. $3,873–$3,880 (Final Target Area)
If price pulls back, watch for support at $3,780 and $3,760 to hold. A breakdown below $3,720 would indicate a shift in momentum.
✅ Conclusion
Gold is showing a technically strong bullish continuation pattern after breaking a key consolidation zone. As long as price remains above the $3,780-$3,760 support zone, the trend favors buyers targeting $3,820, $3,850, and potentially $3,873+.
Traders may consider entering on retracements with stop-losses below the $3,760 zone, targeting the upper resistance levels.
Support Me For More Insightful Analysis.
🔹 Market Structure Overview
Gold has resumed its upward trend after a consolidation breakout, as shown in the middle of the chart. The breakout is supported by increased bullish volume, indicating strong buying interest.
Price is currently trading at $3,796, moving towards the defined target zones, with a clean bullish structure of higher highs and higher lows.
🔍 Key Technical Levels
🔼 Resistance & Target Zones:
▪1st Target Area: $3,820
▫Closely aligned with previous short-term resistance. A minor consolidation may occur here before continuation.
▪2nd Target Zone: $3,850
▫A more significant resistance level, where sellers may re-enter. Monitor for reversal patterns or a breakout confirmation.
▪Final Target Area: $3,873 - $3,880
* Represents a potential exhaustion point for the current bullish leg. Price action here will determine if a larger breakout or retracement follows.
🟩 Support Levels:
▪RBS Level (Resistance Becomes Support): Around $3,780
▫Price has flipped this level into support after breaking above - a classic retest confirming strength.
▪Support Area: $3,760 - $3,780
▫Recent bullish reactions from this area make it a short-term demand zone.
▪Strong Support Level: $3,720
▫ Historically significant level with multiple bounce points. A break below this would invalidate the current bullish setup.
📊 Volume Analysis
▫ Notable volume spike occurred at the breakout point of the consolidation range (highlighted circle), validating bullish momentum.
▫Sustained volume during the upward move suggests strong institutional interest.
📈 Price Action Insights
▪ Consolidation Breakout: After a period of sideways movement, price broke above the consolidation range, suggesting accumulation and a bullish continuation.
▪Bullish Retest: The market performed a clean retest of the breakout zone, confirming buyer control.
▪Steady Climb: No major rejection wicks or bearish engulfing candles observed - market sentiment remains positive.
🔄 Projected Price Movement
The purple projection arrow shows an expected bullish continuation toward:
1. $3,820 (1st Target)
2. $3,850 (2nd Target)
3. $3,873–$3,880 (Final Target Area)
If price pulls back, watch for support at $3,780 and $3,760 to hold. A breakdown below $3,720 would indicate a shift in momentum.
✅ Conclusion
Gold is showing a technically strong bullish continuation pattern after breaking a key consolidation zone. As long as price remains above the $3,780-$3,760 support zone, the trend favors buyers targeting $3,820, $3,850, and potentially $3,873+.
Traders may consider entering on retracements with stop-losses below the $3,760 zone, targeting the upper resistance levels.
Support Me For More Insightful Analysis.
노트
1st layer activated from 3791, 액티브 트레이드
노트
1st target achieved, 300 pips+노트
2nd target reached, 590 pips+거래청산: 타겟 닿음
800 pips+ achieved, 💸FREE FOREX Signals in Telegram : t.me/FxInsightsHub0
🔹Join Our Telegram Channel, Pure Price Action Based Signals With Chart Analysis.
t.me/FxInsightsHub0
🚀FREE CRYPTO Signals In Telegram: t.me/FxInsightsHub0
🔹Join Our Telegram Channel, Pure Price Action Based Signals With Chart Analysis.
t.me/FxInsightsHub0
🚀FREE CRYPTO Signals In Telegram: t.me/FxInsightsHub0
관련 발행물
면책사항
이 정보와 게시물은 TradingView에서 제공하거나 보증하는 금융, 투자, 거래 또는 기타 유형의 조언이나 권고 사항을 의미하거나 구성하지 않습니다. 자세한 내용은 이용 약관을 참고하세요.
💸FREE FOREX Signals in Telegram : t.me/FxInsightsHub0
🔹Join Our Telegram Channel, Pure Price Action Based Signals With Chart Analysis.
t.me/FxInsightsHub0
🚀FREE CRYPTO Signals In Telegram: t.me/FxInsightsHub0
🔹Join Our Telegram Channel, Pure Price Action Based Signals With Chart Analysis.
t.me/FxInsightsHub0
🚀FREE CRYPTO Signals In Telegram: t.me/FxInsightsHub0
관련 발행물
면책사항
이 정보와 게시물은 TradingView에서 제공하거나 보증하는 금융, 투자, 거래 또는 기타 유형의 조언이나 권고 사항을 의미하거나 구성하지 않습니다. 자세한 내용은 이용 약관을 참고하세요.