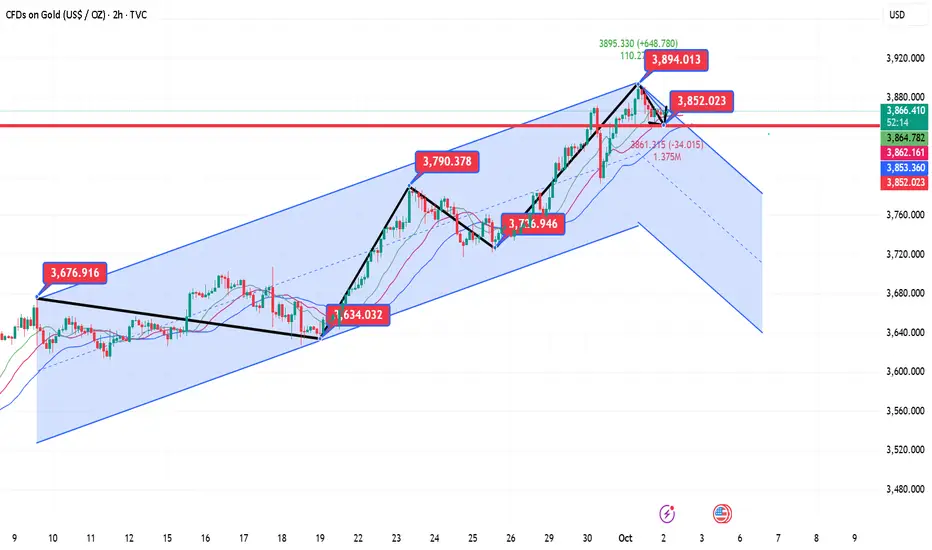
Gold prices naturally retreated after hitting a new high on Wednesday, but the candlestick chart remains oscillating upward (with higher lows). If prices fall below the midline of the trend channel at 3869, the market is likely to shift towards the 3850-35 range. Currently, gold prices are showing this trend. Conservative investors can consider entering the market based on whether the 3834/35 support levels are broken (a rebound could reach as high as 50; if it falls below, the market is bearish and could reach 3810).
Reference support levels: 3849, 3834, and 3794.
Reference resistance levels: 3880, 3903, and 3917.
Reference support levels: 3849, 3834, and 3794.
Reference resistance levels: 3880, 3903, and 3917.
액티브 트레이드
The market has no absolutes, nor fixed trends of ups and downs. Therefore, a balanced assessment of market fluctuations is your key to success. Let money be our loyal servant; otherwise, it will become a tyrannical master. If you have any questions about the market, please leave a message for David.관련 발행물
면책사항
해당 정보와 게시물은 금융, 투자, 트레이딩 또는 기타 유형의 조언이나 권장 사항으로 간주되지 않으며, 트레이딩뷰에서 제공하거나 보증하는 것이 아닙니다. 자세한 내용은 이용 약관을 참조하세요.
관련 발행물
면책사항
해당 정보와 게시물은 금융, 투자, 트레이딩 또는 기타 유형의 조언이나 권장 사항으로 간주되지 않으며, 트레이딩뷰에서 제공하거나 보증하는 것이 아닙니다. 자세한 내용은 이용 약관을 참조하세요.