🔹Gold (XAU/USD) – 30-Minute Chart Technical Outlook
▪️Market Structure:
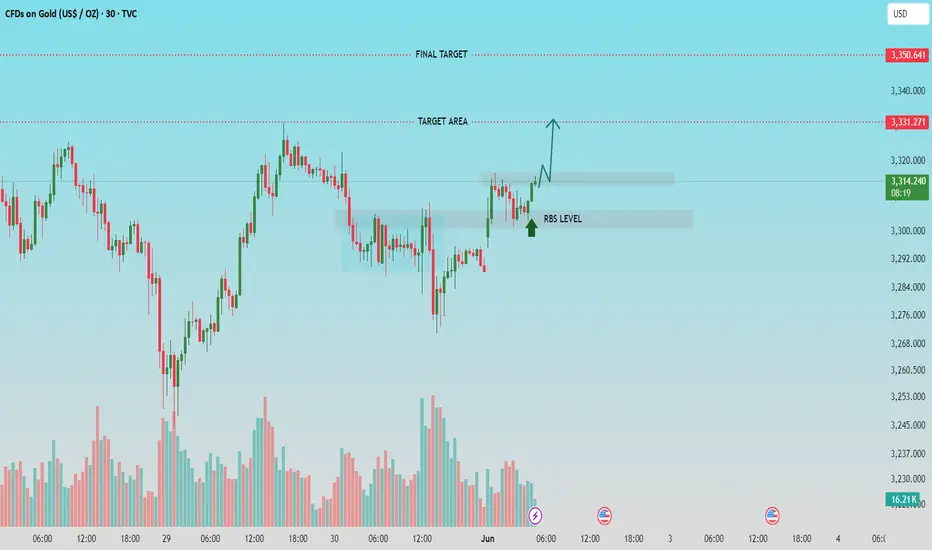
Gold is currently showing signs of bullish continuation following a breakout above a previous resistance area, now turned RBS (Resistance Becomes Support) level near $3,308-$3,310.
▪️Key Levels:
* RBS Level: $3,308 (prior resistance, now acting as support)
* Target Area: $3,331
* Final Target: $3,351
▪️Price Action Insight:
After a brief consolidation, price has broken above short-term resistance and is retesting the RBS level, confirming it as new support. Bullish momentum is indicated by the rising volume during the breakout phase and a strong bullish candle retesting support.
▪️Trade Bias:
* Bullish Bias: As long as price holds above the RBS zone, continuation toward the target area at $3,331 is likely.
* If momentum sustains, final target at $3,351 remains in sight.
* A breakdown below the RBS level would invalidate this bullish setup and suggest reevaluation.
▪️Conclusion:
The current structure favors buyers, with confirmation of support at the RBS level providing a potential low-risk entry for a long position. Targets are clearly defined, with favorable risk-to-reward as long as price sustains above the breakout zone.
🔹Community Insight:
If you find this analysis helpful in your trading journey, feel free to share your thoughts or questions in the comments. Let’s work together to maintain a disciplined, technical approach to the markets.
▪️Follow for regular updates and trade setups.
▪️Market Structure:
Gold is currently showing signs of bullish continuation following a breakout above a previous resistance area, now turned RBS (Resistance Becomes Support) level near $3,308-$3,310.
▪️Key Levels:
* RBS Level: $3,308 (prior resistance, now acting as support)
* Target Area: $3,331
* Final Target: $3,351
▪️Price Action Insight:
After a brief consolidation, price has broken above short-term resistance and is retesting the RBS level, confirming it as new support. Bullish momentum is indicated by the rising volume during the breakout phase and a strong bullish candle retesting support.
▪️Trade Bias:
* Bullish Bias: As long as price holds above the RBS zone, continuation toward the target area at $3,331 is likely.
* If momentum sustains, final target at $3,351 remains in sight.
* A breakdown below the RBS level would invalidate this bullish setup and suggest reevaluation.
▪️Conclusion:
The current structure favors buyers, with confirmation of support at the RBS level providing a potential low-risk entry for a long position. Targets are clearly defined, with favorable risk-to-reward as long as price sustains above the breakout zone.
🔹Community Insight:
If you find this analysis helpful in your trading journey, feel free to share your thoughts or questions in the comments. Let’s work together to maintain a disciplined, technical approach to the markets.
▪️Follow for regular updates and trade setups.
액티브 트레이드
노트
거래청산: 타겟 닿음
💸FREE FOREX Signals in Telegram : t.me/FxInsightsHub0
🔹Join Our Telegram Channel, Pure Price Action Based Signals With Chart Analysis.
t.me/FxInsightsHub0
🚀FREE CRYPTO Signals In Telegram: t.me/FxInsightsHub0
🔹Join Our Telegram Channel, Pure Price Action Based Signals With Chart Analysis.
t.me/FxInsightsHub0
🚀FREE CRYPTO Signals In Telegram: t.me/FxInsightsHub0
관련 발행물
면책사항
이 정보와 게시물은 TradingView에서 제공하거나 보증하는 금융, 투자, 거래 또는 기타 유형의 조언이나 권고 사항을 의미하거나 구성하지 않습니다. 자세한 내용은 이용 약관을 참고하세요.