🧭 Overall Structure
The chart shows a potential bearish setup.
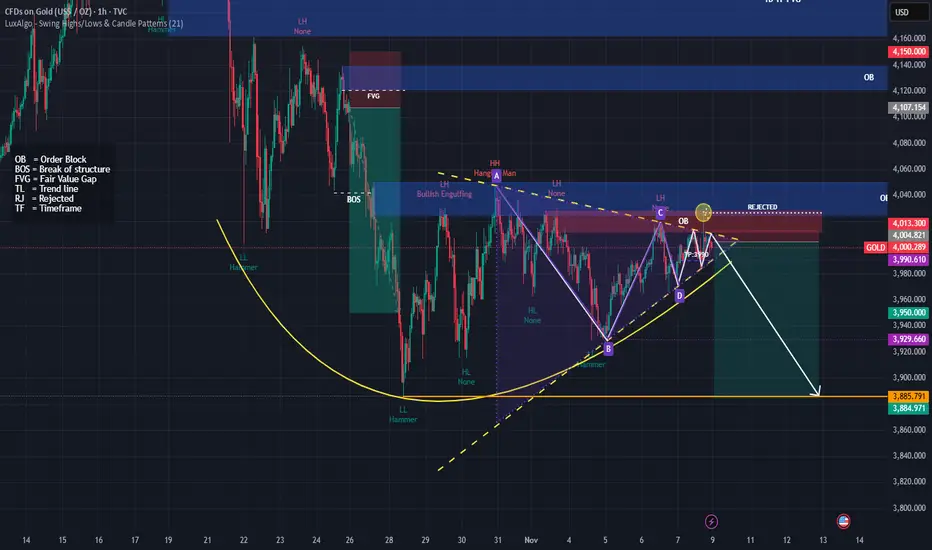
I have drawn a descending pattern (A-B-C-D) with rejection from an Order Block (OB) around $4,013–$4,020.
The white arrow projects a downward move toward 3,885.
🔍 Key Technical Elements
1. Order Blocks (OB)
Upper OB (~4,150–4,120): Higher timeframe supply zone; strong resistance if price rallies.
Current OB (~4,013–4,040): Recently rejected here — price reacted and failed to make a new higher high → confirms seller pressure.
2. Break of Structure (BOS)
A previous BOS occurred to the downside, suggesting bearish momentum took control after a temporary bullish leg.
3. Trend Lines (Yellow Dashed)
The upper TL connects lower highs → consistent downtrend.
The lower TL (support) was recently tested and might break soon — signaling bearish continuation.
4. Pattern
A–B–C–D harmonic-like pattern completed near the order block, often signaling a sell opportunity when it aligns with rejection zones.
Price formed a lower high (LH) at point C and another at D → confirms trend weakness.
5. Candlestick Rejection
“Rejected” and “Hammer” labels near point D and OB zone show failed bullish attempts → adds confluence for short.
🎯 Bearish Targets
TP1: 3,950 (nearest support)
TP2: 3,930 (previous low)
TP3 (Major): 3,885 (strong historical support zone)
⚠️ Invalidation
If price closes above 4,040–4,060 (OB zone), bearish setup invalidates.
That would mean liquidity grab and possible push toward 4,100–4,150 OB.
🧩 Summary
Bias Entry Zone Confirmation Targets Invalidation
Bearish 4,010–4,020 OB zone Rejection + lower high 3,950 → 3,930 → 3,885 Close above 4,060
The chart shows a potential bearish setup.
I have drawn a descending pattern (A-B-C-D) with rejection from an Order Block (OB) around $4,013–$4,020.
The white arrow projects a downward move toward 3,885.
🔍 Key Technical Elements
1. Order Blocks (OB)
Upper OB (~4,150–4,120): Higher timeframe supply zone; strong resistance if price rallies.
Current OB (~4,013–4,040): Recently rejected here — price reacted and failed to make a new higher high → confirms seller pressure.
2. Break of Structure (BOS)
A previous BOS occurred to the downside, suggesting bearish momentum took control after a temporary bullish leg.
3. Trend Lines (Yellow Dashed)
The upper TL connects lower highs → consistent downtrend.
The lower TL (support) was recently tested and might break soon — signaling bearish continuation.
4. Pattern
A–B–C–D harmonic-like pattern completed near the order block, often signaling a sell opportunity when it aligns with rejection zones.
Price formed a lower high (LH) at point C and another at D → confirms trend weakness.
5. Candlestick Rejection
“Rejected” and “Hammer” labels near point D and OB zone show failed bullish attempts → adds confluence for short.
🎯 Bearish Targets
TP1: 3,950 (nearest support)
TP2: 3,930 (previous low)
TP3 (Major): 3,885 (strong historical support zone)
⚠️ Invalidation
If price closes above 4,040–4,060 (OB zone), bearish setup invalidates.
That would mean liquidity grab and possible push toward 4,100–4,150 OB.
🧩 Summary
Bias Entry Zone Confirmation Targets Invalidation
Bearish 4,010–4,020 OB zone Rejection + lower high 3,950 → 3,930 → 3,885 Close above 4,060
면책사항
이 정보와 게시물은 TradingView에서 제공하거나 보증하는 금융, 투자, 거래 또는 기타 유형의 조언이나 권고 사항을 의미하거나 구성하지 않습니다. 자세한 내용은 이용 약관을 참고하세요.
면책사항
이 정보와 게시물은 TradingView에서 제공하거나 보증하는 금융, 투자, 거래 또는 기타 유형의 조언이나 권고 사항을 의미하거나 구성하지 않습니다. 자세한 내용은 이용 약관을 참고하세요.