# 🟡 GOLD (XAU/USD) Weekly Open Analysis – H2 Structure
**Date:** 2025/08/11
**Timeframe:** 2H (Heikin Ashi)
**Style:** Smart Money Concept (SMC) + Supply/Demand + Price Action
---
## 📊 Market Context
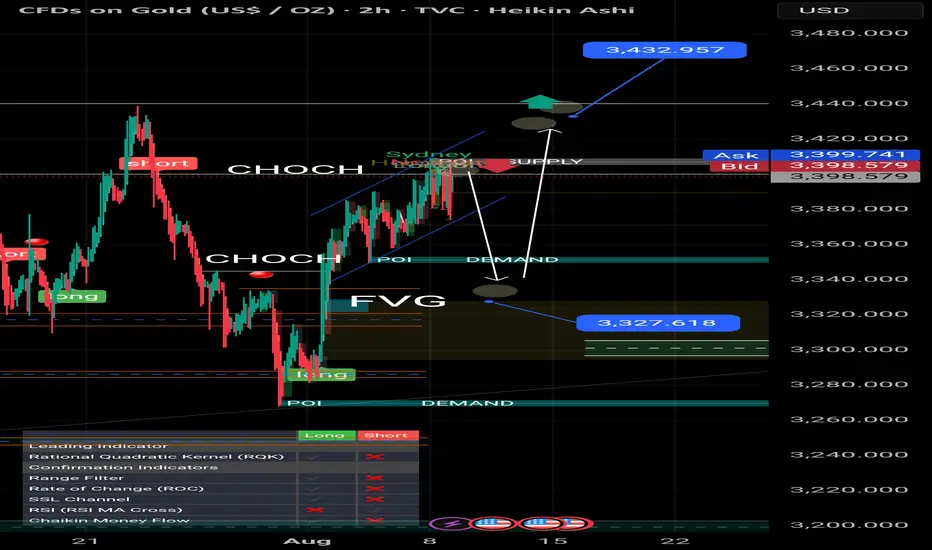
At the weekly open, gold price has started trading above the **upper parallel channel** where last week's close was printed. This level acts as a short-term **bullish bias zone**.
Simultaneously, the **Dollar Index (DXY)** opened at lower levels, showing signs of weakness. Historically, a falling DXY often supports upward movement in gold, and we may see a reaction as mapped in the chart.
---
## 🔍 Key Technical Levels
- **Upper CHOCH Breakout Zone:** ~**3,399 – 3,400**
- **Major Supply Zone:** ~**3,440 – 3,445**
- **Demand Zone #1:** **3,345 – 3,350** (POI)
- **Demand Zone #2:** **3,320 – 3,330** (FVG completion)
- **Final Demand Floor:** **3,260 – 3,265**
---
## 📈 Bullish Scenario (Primary)
1. **Condition:** CHOCH breakout above **3,400** with a bullish BOS confirmation.
2. **Entry Zone:** Retest near **3,399 – 3,402** after breakout.
3. **Targets:**
- 🎯 TP1: **3,420**
- 🎯 TP2: **3,432**
- 🎯 TP3: **3,445** (Major Supply)
4. **Invalidation:** Close back below **3,395** after breakout attempt.
---
## 📉 Bearish Scenario (Alternative)
1. **Condition:** Price fails to break the upper CHOCH and rejects from **3,399 – 3,400**.
2. **Expected Move:** Drop towards **Demand Zone #1** (**3,345 – 3,350**).
3. **If Demand #1 Fails:** Continuation towards **Demand Zone #2** (**3,320 – 3,330**).
4. **Final Target in Deep Drop:** **3,260 – 3,265** (lowest demand line in chart).
---
## ⚠️ Analysis Validity
> This analysis remains valid **as long as the upper CHOCH is not broken to the upside**.
> If the CHOCH breaks and a bullish BOS forms, the bearish path will be invalidated, shifting the focus to the upside targets.
---
📌 **Note:** Always combine with DXY monitoring – a significant DXY rally could limit gold’s bullish potential.
#XAUUSD #GoldAnalysis #SMC #SupplyDemand #CHOCH #BOS #TradingView
**Date:** 2025/08/11
**Timeframe:** 2H (Heikin Ashi)
**Style:** Smart Money Concept (SMC) + Supply/Demand + Price Action
---
## 📊 Market Context
At the weekly open, gold price has started trading above the **upper parallel channel** where last week's close was printed. This level acts as a short-term **bullish bias zone**.
Simultaneously, the **Dollar Index (DXY)** opened at lower levels, showing signs of weakness. Historically, a falling DXY often supports upward movement in gold, and we may see a reaction as mapped in the chart.
---
## 🔍 Key Technical Levels
- **Upper CHOCH Breakout Zone:** ~**3,399 – 3,400**
- **Major Supply Zone:** ~**3,440 – 3,445**
- **Demand Zone #1:** **3,345 – 3,350** (POI)
- **Demand Zone #2:** **3,320 – 3,330** (FVG completion)
- **Final Demand Floor:** **3,260 – 3,265**
---
## 📈 Bullish Scenario (Primary)
1. **Condition:** CHOCH breakout above **3,400** with a bullish BOS confirmation.
2. **Entry Zone:** Retest near **3,399 – 3,402** after breakout.
3. **Targets:**
- 🎯 TP1: **3,420**
- 🎯 TP2: **3,432**
- 🎯 TP3: **3,445** (Major Supply)
4. **Invalidation:** Close back below **3,395** after breakout attempt.
---
## 📉 Bearish Scenario (Alternative)
1. **Condition:** Price fails to break the upper CHOCH and rejects from **3,399 – 3,400**.
2. **Expected Move:** Drop towards **Demand Zone #1** (**3,345 – 3,350**).
3. **If Demand #1 Fails:** Continuation towards **Demand Zone #2** (**3,320 – 3,330**).
4. **Final Target in Deep Drop:** **3,260 – 3,265** (lowest demand line in chart).
---
## ⚠️ Analysis Validity
> This analysis remains valid **as long as the upper CHOCH is not broken to the upside**.
> If the CHOCH breaks and a bullish BOS forms, the bearish path will be invalidated, shifting the focus to the upside targets.
---
📌 **Note:** Always combine with DXY monitoring – a significant DXY rally could limit gold’s bullish potential.
#XAUUSD #GoldAnalysis #SMC #SupplyDemand #CHOCH #BOS #TradingView
면책사항
해당 정보와 게시물은 금융, 투자, 트레이딩 또는 기타 유형의 조언이나 권장 사항으로 간주되지 않으며, 트레이딩뷰에서 제공하거나 보증하는 것이 아닙니다. 자세한 내용은 이용 약관을 참조하세요.
면책사항
해당 정보와 게시물은 금융, 투자, 트레이딩 또는 기타 유형의 조언이나 권장 사항으로 간주되지 않으며, 트레이딩뷰에서 제공하거나 보증하는 것이 아닙니다. 자세한 내용은 이용 약관을 참조하세요.