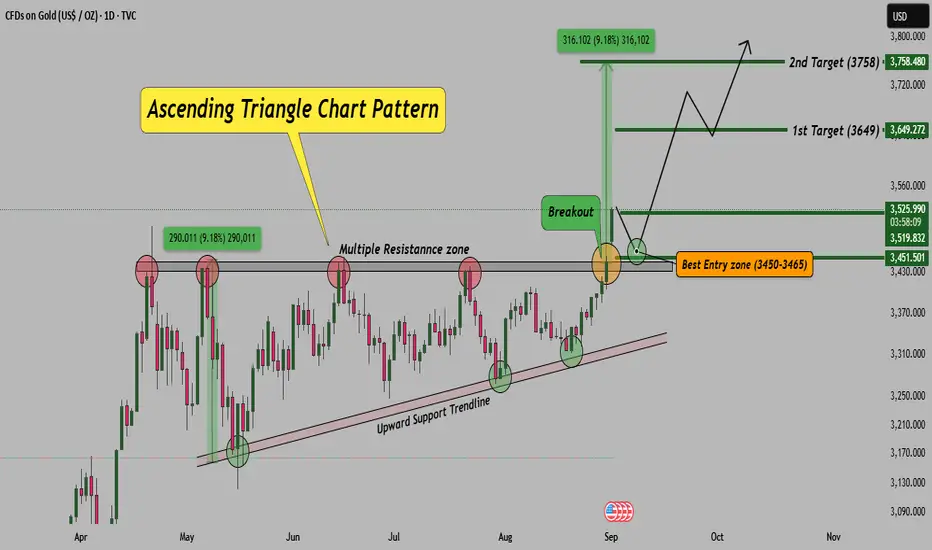
Gold has formed a strong ascending triangle pattern on the daily timeframe. The price has successfully broken above the resistance zone, confirming bullish momentum. Such patterns generally indicate continuation of the uptrend, especially when supported by volume and strong price action.
Chart Observation:
Note: If levels sustain and setup remains intact, I will share live trade updates in real time. Stay tuned.
Disclaimer: This analysis is for educational purposes only. Please do your own research or consult your financial advisor before taking trades.
Chart Observation:
- As long as price holds above 3,450, the bullish setup remains valid.
- A retest of the breakout zone can provide the best risk-to-reward entry opportunity.
- Traders should keep an eye on volume confirmation while entering trades.
Note: If levels sustain and setup remains intact, I will share live trade updates in real time. Stay tuned.
Disclaimer: This analysis is for educational purposes only. Please do your own research or consult your financial advisor before taking trades.
Premium Signals: 77% accuracy in Intraday & Positional trades for Stocks, Nifty, Bank Nifty, Gold, Silver & Crypto. Take demo & decide — most traders don’t leave after joining.
Free Demo: wa.me/919560602464
Free Telegram: spf.bio/c1lkb
Free Demo: wa.me/919560602464
Free Telegram: spf.bio/c1lkb
관련 발행물
면책사항
해당 정보와 게시물은 금융, 투자, 트레이딩 또는 기타 유형의 조언이나 권장 사항으로 간주되지 않으며, 트레이딩뷰에서 제공하거나 보증하는 것이 아닙니다. 자세한 내용은 이용 약관을 참조하세요.