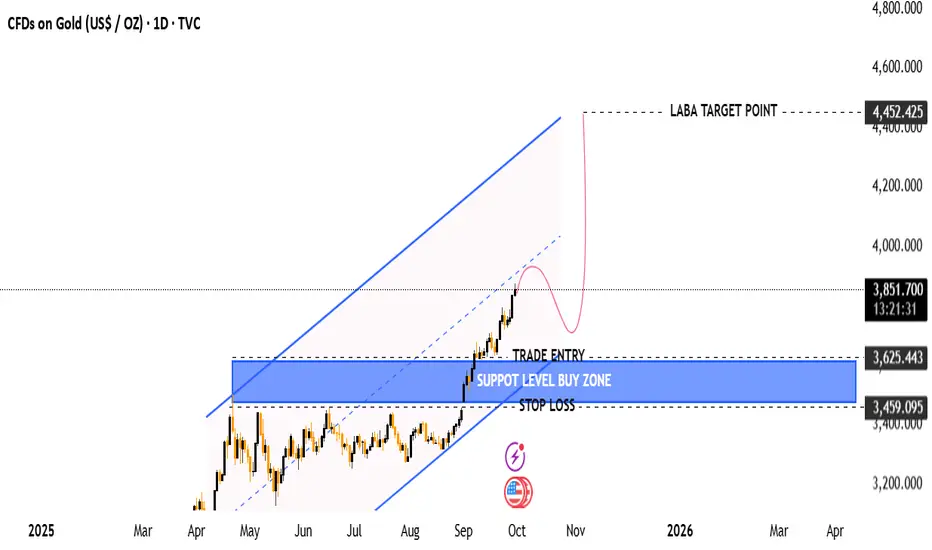
(Gold Daily - as of Sep 30, 2025)
Current Price: ~$3,851.68
Trend: Strong uptrend with price following a rising channel
Timeframe: Daily candles
Tool Used: TradingView
🧩 Key Chart Elements
Support Level Buy Zone (Blue Box)
Range: $3,459.10 – $3,625.44
This is the planned re-entry/buy zone.
Coincides with a previous resistance zone turned support, and the lower bound of the channel.
Trade Entry Point
Suggested entry near $3,625.44
Aligned with the lower edge of the blue support zone.
Stop Loss
Placed slightly below the blue zone at $3,459.10
This protects against a breakdown from the channel and invalidation of the setup.
Price Action Forecast (Pink Line)
Expectation of a short-term pullback into the buy zone.
Followed by a strong bullish continuation toward the target.
Target Point
$4,452.425 marked as the LABA TARGET POINT
Suggests a long-term upside potential of around +17% from current price levels.
Trend Channel
Price is respecting an upward sloping parallel channel.
This provides structure and validation for the projected bullish move.
📈 Strategy Summary
Element Value
Buy Zone $3,459 – $3,625
Target $4,452
Stop Loss ~$3,459
Risk/Reward Favorable
Trend Bullish
🔍 Final Thoughts
This is a momentum-based trend-following strategy:
Wait for a retracement into the support zone.
Look for bullish reversal confirmation (e.g. bullish engulfing, RSI bounce, etc.).
Enter long with stop just below the zone.
Hold for the move toward ~$4,450.
join my telegram channel t.me/goldmitalteam
t.me/goldmitalteam
t.me/goldmitalteam
면책사항
해당 정보와 게시물은 금융, 투자, 트레이딩 또는 기타 유형의 조언이나 권장 사항으로 간주되지 않으며, 트레이딩뷰에서 제공하거나 보증하는 것이 아닙니다. 자세한 내용은 이용 약관을 참조하세요.
join my telegram channel t.me/goldmitalteam
t.me/goldmitalteam
t.me/goldmitalteam
면책사항
해당 정보와 게시물은 금융, 투자, 트레이딩 또는 기타 유형의 조언이나 권장 사항으로 간주되지 않으며, 트레이딩뷰에서 제공하거나 보증하는 것이 아닙니다. 자세한 내용은 이용 약관을 참조하세요.