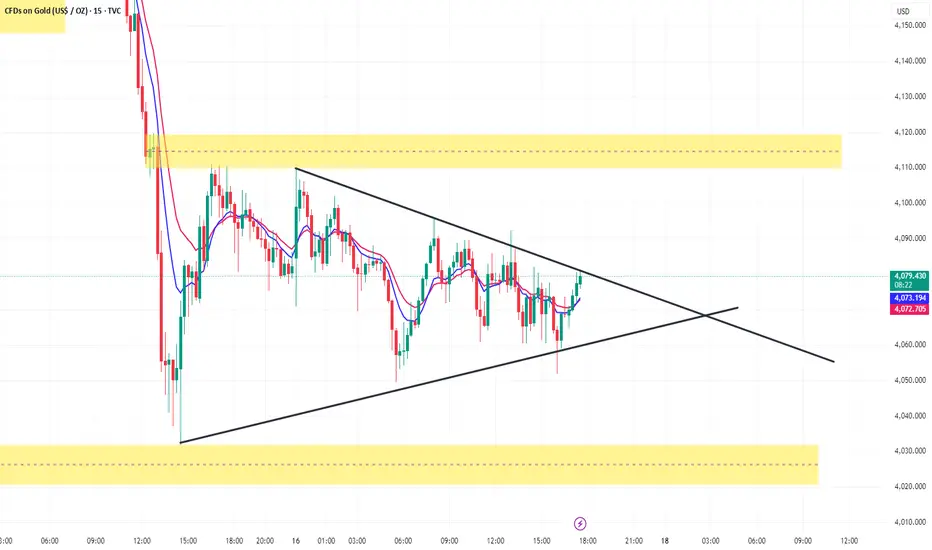
**Symmetrical Triangle** structure.
### **Why this is a Symmetrical Triangle**
* You have **lower highs** (descending trendline from top).
* You have **higher lows** (ascending trendline from bottom).
* Price is getting squeezed toward the **apex**.
* Volatility is decreasing → typical behavior before a breakout.
### **What this structure means**
A symmetrical triangle is a **neutral continuation pattern**, meaning:
* It can break **up** or **down**, depending on which side is broken with volume.
* The breakout usually decides the next big move.
### **Key breakout zones**
* **Bullish breakout:** Above ~4088–4092 zone (upper trendline + near supply)
* **Bearish breakout:** Below ~4060–4055 zone (lower trendline)
### **Also important**
You have **strong supply above** (yellow zone) and **strong demand below**, so expect:
* Fakeouts (liquidity grabs)
* Strong move after breakout
If you want, I can give you:
✔ Next expected move
✔ Buy/Sell bias
✔ SL/TP ideas based on your triangle
✔ Probability of breakout direction
면책사항
해당 정보와 게시물은 금융, 투자, 트레이딩 또는 기타 유형의 조언이나 권장 사항으로 간주되지 않으며, 트레이딩뷰에서 제공하거나 보증하는 것이 아닙니다. 자세한 내용은 이용 약관을 참조하세요.
면책사항
해당 정보와 게시물은 금융, 투자, 트레이딩 또는 기타 유형의 조언이나 권장 사항으로 간주되지 않으며, 트레이딩뷰에서 제공하거나 보증하는 것이 아닙니다. 자세한 내용은 이용 약관을 참조하세요.