Key Elements Visible:
🔹 Current Market Price:
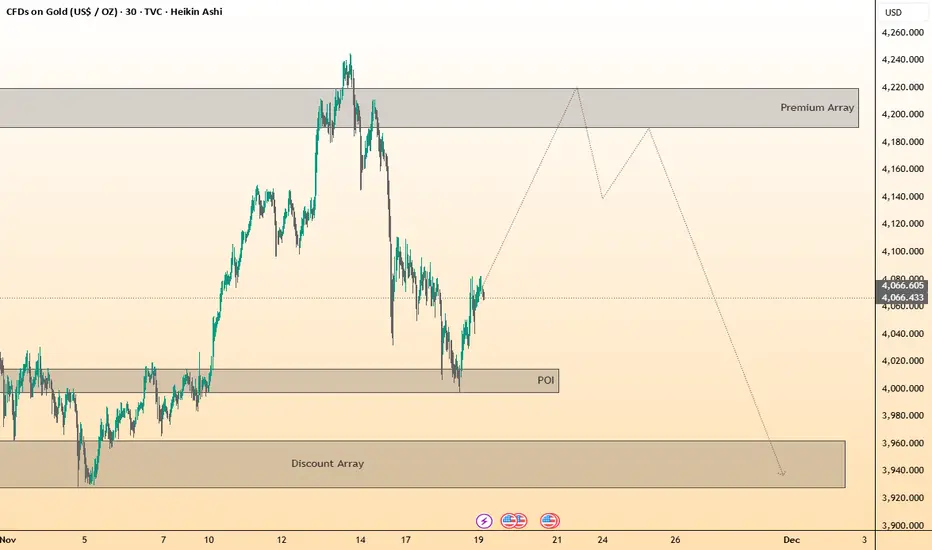
Price is trading around 4066.
🔹 Previous Swing High Zone:
A Premium Array is drawn as a large grey zone around the 4180–4220 area, indicating a potential distribution or sell zone where price may react after grabbing liquidity.
🔹 Previous Swing Low / POI:
A Point of Interest (POI) is marked below, around the 4000–4020 region. This is shown as a discount area where buyers may step in.
🔹 Discount Array:
At the bottom of the chart, a large Discount Array box is shaded, around the 3920–3980 zone, suggesting a deeper liquidity pool or bearish objective if the lower POIs are taken.
🔹 Projected Price Path:
A speculative line (market structure projection) is drawn showing:
A move upwards toward the Premium Array zone
Followed by a sharp reversal downward, targeting the Discount Array
🔹 Market Structure Context:
The current price appears in a retracement phase, attempting to recover from a previous sharp decline.
🔹 Current Market Price:
Price is trading around 4066.
🔹 Previous Swing High Zone:
A Premium Array is drawn as a large grey zone around the 4180–4220 area, indicating a potential distribution or sell zone where price may react after grabbing liquidity.
🔹 Previous Swing Low / POI:
A Point of Interest (POI) is marked below, around the 4000–4020 region. This is shown as a discount area where buyers may step in.
🔹 Discount Array:
At the bottom of the chart, a large Discount Array box is shaded, around the 3920–3980 zone, suggesting a deeper liquidity pool or bearish objective if the lower POIs are taken.
🔹 Projected Price Path:
A speculative line (market structure projection) is drawn showing:
A move upwards toward the Premium Array zone
Followed by a sharp reversal downward, targeting the Discount Array
🔹 Market Structure Context:
The current price appears in a retracement phase, attempting to recover from a previous sharp decline.
ICT • CRT • Turtle Soup • Judas Swing Specialist
Free Mentorship | 90% Accuracy Signals : t.me/+JWhq_LKy2_RjNzBk
Free Mentorship | 90% Accuracy Signals : t.me/+JWhq_LKy2_RjNzBk
면책사항
해당 정보와 게시물은 금융, 투자, 트레이딩 또는 기타 유형의 조언이나 권장 사항으로 간주되지 않으며, 트레이딩뷰에서 제공하거나 보증하는 것이 아닙니다. 자세한 내용은 이용 약관을 참조하세요.
ICT • CRT • Turtle Soup • Judas Swing Specialist
Free Mentorship | 90% Accuracy Signals : t.me/+JWhq_LKy2_RjNzBk
Free Mentorship | 90% Accuracy Signals : t.me/+JWhq_LKy2_RjNzBk
면책사항
해당 정보와 게시물은 금융, 투자, 트레이딩 또는 기타 유형의 조언이나 권장 사항으로 간주되지 않으며, 트레이딩뷰에서 제공하거나 보증하는 것이 아닙니다. 자세한 내용은 이용 약관을 참조하세요.