📊 Professional Analysis
Timeframe & Price Action
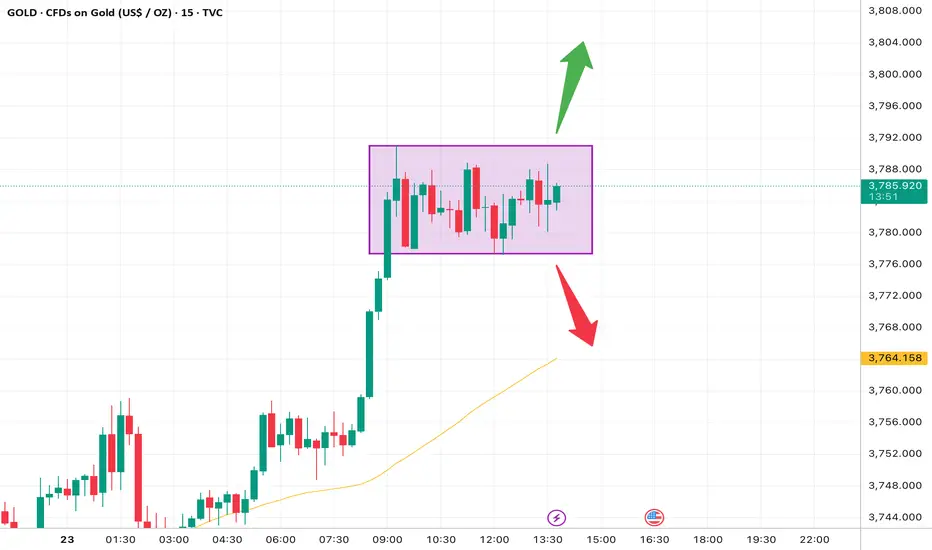
This is XAUUSD on the 15-minute chart. After a strong bullish impulse, price has entered a sideways consolidation range between 3780 – 3790 (purple box).
Market Structure
Prior trend: Strong bullish rally.
Current action: A box/range formation — the market is gathering liquidity before the next move.
This is often a continuation pattern, but both directions remain possible.
Moving Average
The yellow line (likely 50-period MA) is trending upward and is well below current price, confirming the bullish bias. However, the distance suggests a possible short-term pullback if the range breaks downward.
Scenarios
🔼 Bullish Breakout:
If price closes above 3790, next upside targets are 3805 (first resistance) and 3810–3812 (extended target).
🔽 Bearish Breakdown:
A break and close below 3780 could trigger a drop toward 3765 and possibly 3760–3755 near the MA support.
🎯 Trading Plan (15-Minute Setup)
Bullish Scenario (Breakout Up)
Entry: Above 3790 after a confirmed 15M candle close.
Stop Loss: Below the box, around 3778.
Take Profit:
TP1: 3805
TP2: 3810 – 3812
Bearish Scenario (Breakout Down)
Entry: Below 3780 with confirmation.
Stop Loss: Above the box, around 3793.
Take Profit:
TP1: 3765
TP2: 3755 – 3760 (near the MA).
⚖️ Risk Management & Notes
On the 15M chart, false breakouts are common — wait for a full candle close beyond the box.
Keep risk per trade around 1–2% max.
Momentum is still bullish, so the upside breakout has slightly higher probability, but always be prepared for the downside scenario.
Timeframe & Price Action
This is XAUUSD on the 15-minute chart. After a strong bullish impulse, price has entered a sideways consolidation range between 3780 – 3790 (purple box).
Market Structure
Prior trend: Strong bullish rally.
Current action: A box/range formation — the market is gathering liquidity before the next move.
This is often a continuation pattern, but both directions remain possible.
Moving Average
The yellow line (likely 50-period MA) is trending upward and is well below current price, confirming the bullish bias. However, the distance suggests a possible short-term pullback if the range breaks downward.
Scenarios
🔼 Bullish Breakout:
If price closes above 3790, next upside targets are 3805 (first resistance) and 3810–3812 (extended target).
🔽 Bearish Breakdown:
A break and close below 3780 could trigger a drop toward 3765 and possibly 3760–3755 near the MA support.
🎯 Trading Plan (15-Minute Setup)
Bullish Scenario (Breakout Up)
Entry: Above 3790 after a confirmed 15M candle close.
Stop Loss: Below the box, around 3778.
Take Profit:
TP1: 3805
TP2: 3810 – 3812
Bearish Scenario (Breakout Down)
Entry: Below 3780 with confirmation.
Stop Loss: Above the box, around 3793.
Take Profit:
TP1: 3765
TP2: 3755 – 3760 (near the MA).
⚖️ Risk Management & Notes
On the 15M chart, false breakouts are common — wait for a full candle close beyond the box.
Keep risk per trade around 1–2% max.
Momentum is still bullish, so the upside breakout has slightly higher probability, but always be prepared for the downside scenario.
면책사항
이 정보와 게시물은 TradingView에서 제공하거나 보증하는 금융, 투자, 거래 또는 기타 유형의 조언이나 권고 사항을 의미하거나 구성하지 않습니다. 자세한 내용은 이용 약관을 참고하세요.
면책사항
이 정보와 게시물은 TradingView에서 제공하거나 보증하는 금융, 투자, 거래 또는 기타 유형의 조언이나 권고 사항을 의미하거나 구성하지 않습니다. 자세한 내용은 이용 약관을 참고하세요.