Date: July 23, 2025
Instrument: Gold (XAU/USD)
Chart Type: Daily (1D)
Source: TradingView
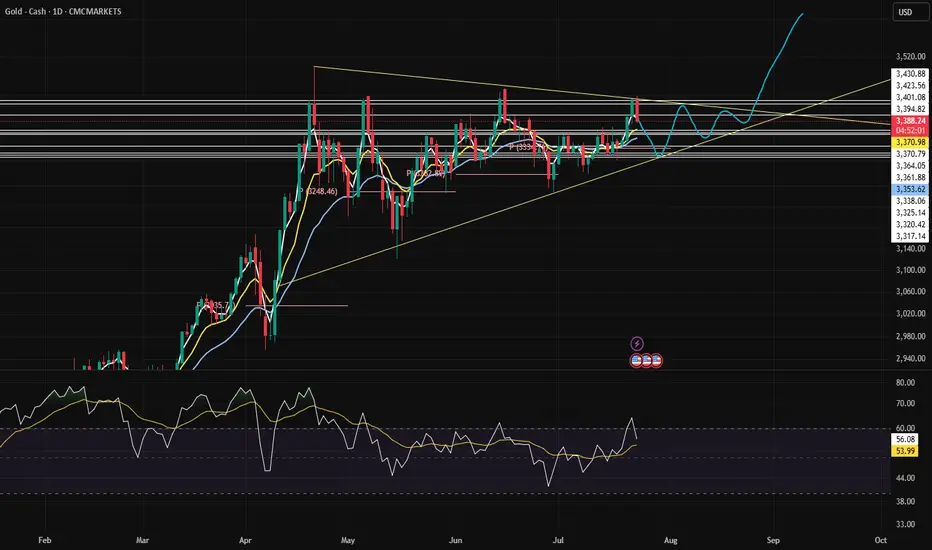
The price of gold is currently consolidating within a symmetrical triangle pattern, suggesting a potential breakout in the coming weeks. As of July 23, gold is trading around $3,390, down by 1.21% on the day. The chart highlights key support and resistance levels, trendlines, and a possible breakout path, providing valuable insight into future price action.
Technical Overview
Pattern Forming: A symmetrical triangle formed since early April, with higher lows and lower highs converging toward an apex.
Support Levels: $3,371.36, $3,370.79, and the lower ascending trendline.
Resistance Levels: $3,395.78, $3,401.08, and the horizontal zone near $3,430.88.
Indicators:
Moving Averages (likely EMA or SMA): Price is interacting with short- and mid-term MAs.
RSI (Relative Strength Index): Currently around 56, indicating bullish momentum without being overbought.
Forecast and Price Path
The chart includes a forecasted price path (in blue) that outlines a possible movement:
A short-term dip to retest the triangle’s lower support area near $3,370.
A bounce followed by sideways consolidation within the triangle.
A bullish breakout projected around early August.
A sharp upward trajectory targeting levels above $3,500, suggesting a strong bullish continuation if the breakout occurs as expected.
Conclusion
This symmetrical triangle is a classic continuation pattern, and given the overall bullish trend from earlier this year, the market may lean toward a breakout to the upside. However, confirmation is crucial: a strong daily close above $3,430 would validate the bullish breakout, while a drop below $3,370 could invalidate this scenario and hint at further consolidation or a downside move.
Traders should watch for volume spikes and RSI behavior near the triangle's apex for clearer breakout signals. Until then, gold remains in a tightening range—preparing for its next major move.
Instrument: Gold (XAU/USD)
Chart Type: Daily (1D)
Source: TradingView
The price of gold is currently consolidating within a symmetrical triangle pattern, suggesting a potential breakout in the coming weeks. As of July 23, gold is trading around $3,390, down by 1.21% on the day. The chart highlights key support and resistance levels, trendlines, and a possible breakout path, providing valuable insight into future price action.
Technical Overview
Pattern Forming: A symmetrical triangle formed since early April, with higher lows and lower highs converging toward an apex.
Support Levels: $3,371.36, $3,370.79, and the lower ascending trendline.
Resistance Levels: $3,395.78, $3,401.08, and the horizontal zone near $3,430.88.
Indicators:
Moving Averages (likely EMA or SMA): Price is interacting with short- and mid-term MAs.
RSI (Relative Strength Index): Currently around 56, indicating bullish momentum without being overbought.
Forecast and Price Path
The chart includes a forecasted price path (in blue) that outlines a possible movement:
A short-term dip to retest the triangle’s lower support area near $3,370.
A bounce followed by sideways consolidation within the triangle.
A bullish breakout projected around early August.
A sharp upward trajectory targeting levels above $3,500, suggesting a strong bullish continuation if the breakout occurs as expected.
Conclusion
This symmetrical triangle is a classic continuation pattern, and given the overall bullish trend from earlier this year, the market may lean toward a breakout to the upside. However, confirmation is crucial: a strong daily close above $3,430 would validate the bullish breakout, while a drop below $3,370 could invalidate this scenario and hint at further consolidation or a downside move.
Traders should watch for volume spikes and RSI behavior near the triangle's apex for clearer breakout signals. Until then, gold remains in a tightening range—preparing for its next major move.
면책사항
이 정보와 게시물은 TradingView에서 제공하거나 보증하는 금융, 투자, 거래 또는 기타 유형의 조언이나 권고 사항을 의미하거나 구성하지 않습니다. 자세한 내용은 이용 약관을 참고하세요.
면책사항
이 정보와 게시물은 TradingView에서 제공하거나 보증하는 금융, 투자, 거래 또는 기타 유형의 조언이나 권고 사항을 의미하거나 구성하지 않습니다. 자세한 내용은 이용 약관을 참고하세요.