Gold analysis next target :
Chart Details
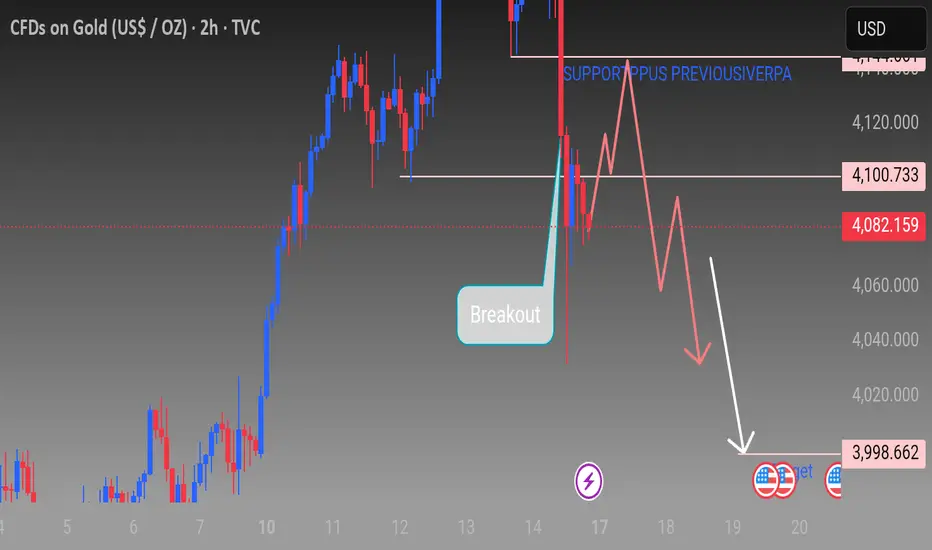
- *Instrument*: CFDs on Gold (US$/OZ)
- *Timeframe*: 2 hours
- *Platform*: TradingView (TVC)
- *Current Price*: $4,082.159 (down -88.991 or -2.13%)
- *Sell/Buy Prices*:
- Sell: $4,082.159 with 1,922
- Buy: $4,084.081
Chart Analysis
- *Trend Indication*: A downward trend is shown with an arrow pointing towards $3,998.662.
- *Breakout*: A breakout is marked on the chart.
- *Support/Resistance*:
- Support plus previous resistance area is marked around $4,100.733.
- Current price ($4,082.159) is below this level.
Other Chart Elements
- *Price Levels*: Prices ranging from $3,998.662 to $4,125.000 are shown on the right side of the chart.
- *Candlestick Chart*: The chart displays red and blue candlesticks indicating price movements.
Please drop your comments below if you found it helpful thanks
Chart Details
- *Instrument*: CFDs on Gold (US$/OZ)
- *Timeframe*: 2 hours
- *Platform*: TradingView (TVC)
- *Current Price*: $4,082.159 (down -88.991 or -2.13%)
- *Sell/Buy Prices*:
- Sell: $4,082.159 with 1,922
- Buy: $4,084.081
Chart Analysis
- *Trend Indication*: A downward trend is shown with an arrow pointing towards $3,998.662.
- *Breakout*: A breakout is marked on the chart.
- *Support/Resistance*:
- Support plus previous resistance area is marked around $4,100.733.
- Current price ($4,082.159) is below this level.
Other Chart Elements
- *Price Levels*: Prices ranging from $3,998.662 to $4,125.000 are shown on the right side of the chart.
- *Candlestick Chart*: The chart displays red and blue candlesticks indicating price movements.
Please drop your comments below if you found it helpful thanks
Free Forex signals & Daily updates 💹
t.me/+D1falYavqJAxMzE0
For any assistance contact us 🤓
t.me/Travis_816
Join Us Today On Telegram 👆👆
t.me/+D1falYavqJAxMzE0
For any assistance contact us 🤓
t.me/Travis_816
Join Us Today On Telegram 👆👆
면책사항
해당 정보와 게시물은 금융, 투자, 트레이딩 또는 기타 유형의 조언이나 권장 사항으로 간주되지 않으며, 트레이딩뷰에서 제공하거나 보증하는 것이 아닙니다. 자세한 내용은 이용 약관을 참조하세요.