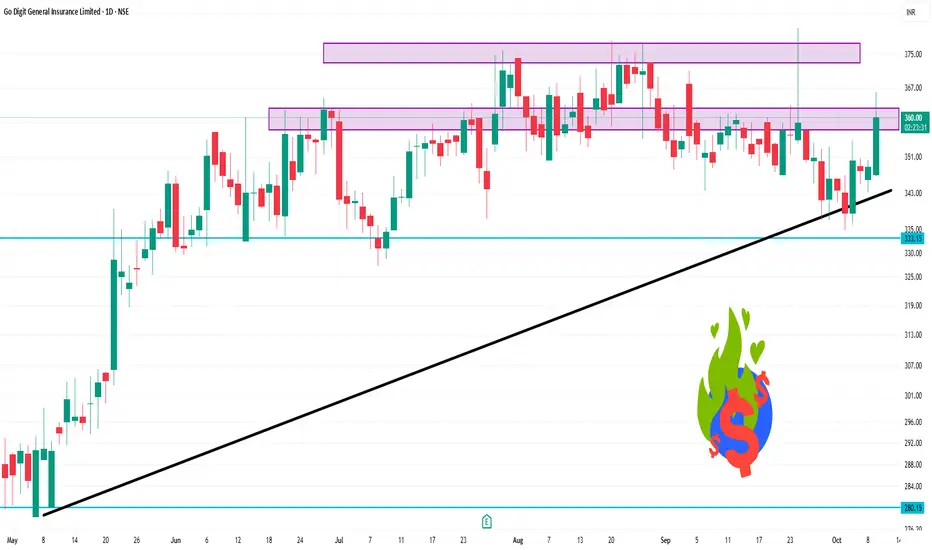
📊 Intraday Price Movement
Day’s Range: ₹346.65 – ₹350.15
Opening Price: ₹347.10
Closing Price (Previous Day): ₹348.80
Volume Traded: Approximately 55,201 shares
📈 Technical Indicators (1-Day Time Frame)
Relative Strength Index (RSI): 35.92 — indicates a neutral stance
Moving Averages:
5-Day EMA: ₹343.23 (Sell)
10-Day EMA: ₹346.88 (Sell)
20-Day EMA: ₹350.54 (Sell)
50-Day EMA: ₹351.97 (Sell)
100-Day EMA: ₹345.69 (Sell)
200-Day EMA: ₹334.59 (Buy)
MACD: -3.83 — suggests a potential buying opportunity
Commodity Channel Index (CCI): -206.91 — indicates a buying signal
Ultimate Oscillator: 28.51 — suggests a sell signal
Price Rate of Change (ROC): -5.88 — indicates a downward trend
🔍 Summary
The stock is exhibiting a neutral to slightly bearish trend in the short term, with several moving averages signaling a sell. However, indicators like MACD and CCI suggest potential buying opportunities. Investors should monitor for a sustained break above ₹350.00 for a more bullish outlook.
관련 발행물
면책사항
해당 정보와 게시물은 금융, 투자, 트레이딩 또는 기타 유형의 조언이나 권장 사항으로 간주되지 않으며, 트레이딩뷰에서 제공하거나 보증하는 것이 아닙니다. 자세한 내용은 이용 약관을 참조하세요.
관련 발행물
면책사항
해당 정보와 게시물은 금융, 투자, 트레이딩 또는 기타 유형의 조언이나 권장 사항으로 간주되지 않으며, 트레이딩뷰에서 제공하거나 보증하는 것이 아닙니다. 자세한 내용은 이용 약관을 참조하세요.