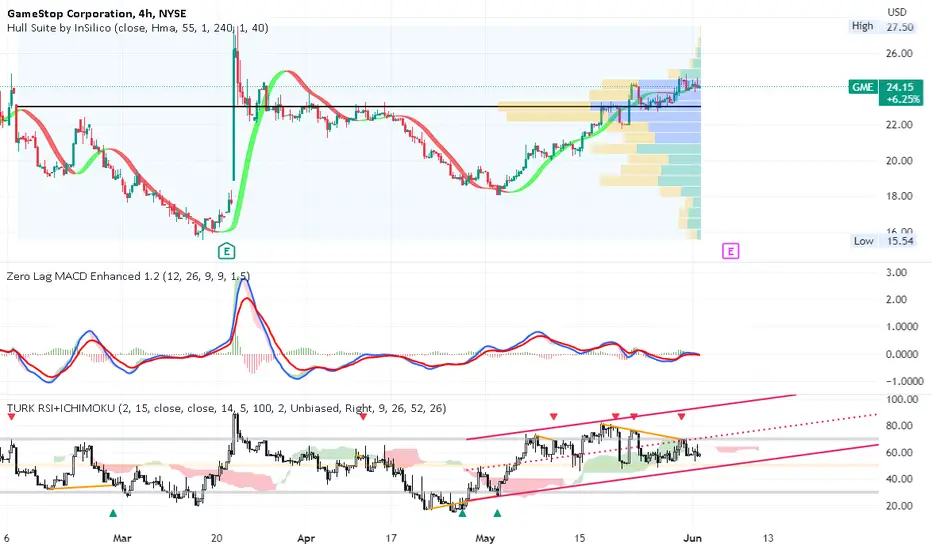
GME on the 4H chart appears to have topped out at the end of May after a decent rise of
30% after the May 2nd bottom. At present, the Hull Suite trend indicator is signaling a
reversal while the MACD zer0 lag indicator shows the lines have crossed under the horizontal
zero and the histogram has turned red. The RSI Indicator is showing a bearish divergence with
strength decreasing from 80 to 60. I see this as a short setup and will take a position of
put options with some long stock shares as risk management and hedging strategy. My target is
a 50% retracement of May's move up and a stop loss above the swing high. GME is still above
the POC line of the volume profile. Once it drops to that value, I expect bearish momentum
acceleration. Earnings are coming. If in profit before earnings, I will take off half the position
for the earnings and then expect GME to rise and stop out the remaining position or drop
quite a bit more.
면책사항
이 정보와 게시물은 TradingView에서 제공하거나 보증하는 금융, 투자, 거래 또는 기타 유형의 조언이나 권고 사항을 의미하거나 구성하지 않습니다. 자세한 내용은 이용 약관을 참고하세요.
면책사항
이 정보와 게시물은 TradingView에서 제공하거나 보증하는 금융, 투자, 거래 또는 기타 유형의 조언이나 권고 사항을 의미하거나 구성하지 않습니다. 자세한 내용은 이용 약관을 참고하세요.