GMAB at a Critical Confluence Zone – Potential Breakout or Reversal?
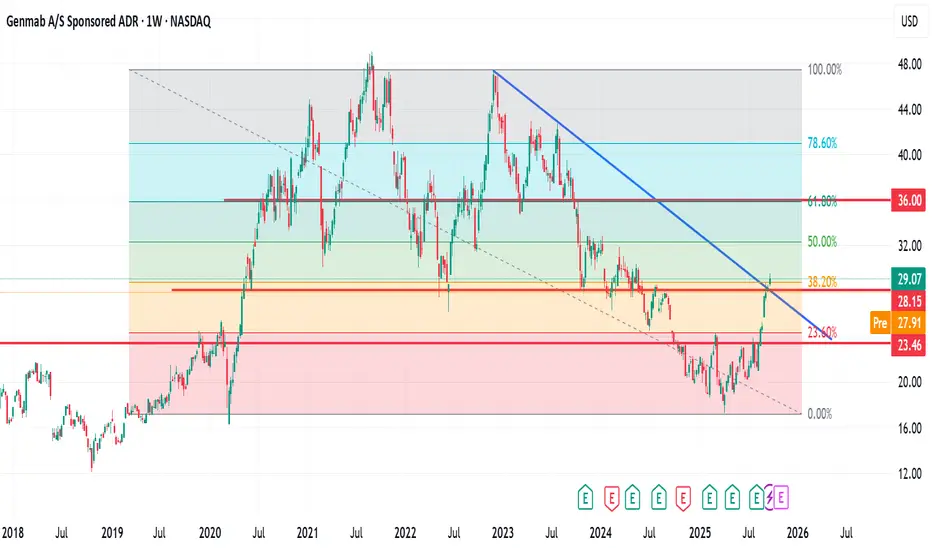
GMAB has shown strong recovery momentum since its April 7th, 2025, low. The price is currently testing a significant confluence area formed by a descending trendline and the Fib 38.2% support level.
If price action holds above this zone, there is potential for a continuation move toward the Fib 61.8% level, which would represent an estimated upside of around 28%.
My Trade Plan:
Initial entry at the current market cap.
Second entry after a confirmed breakout above this confluence zone.
As always, apply proper risk management—trade cautiously and according to your strategy.
🔹 Like, comment, and follow for more trade ideas.
🔹 Let’s connect here on TradingView.
노트
Playing out관련 발행물
면책사항
해당 정보와 게시물은 금융, 투자, 트레이딩 또는 기타 유형의 조언이나 권장 사항으로 간주되지 않으며, 트레이딩뷰에서 제공하거나 보증하는 것이 아닙니다. 자세한 내용은 이용 약관을 참조하세요.
관련 발행물
면책사항
해당 정보와 게시물은 금융, 투자, 트레이딩 또는 기타 유형의 조언이나 권장 사항으로 간주되지 않으며, 트레이딩뷰에서 제공하거나 보증하는 것이 아닙니다. 자세한 내용은 이용 약관을 참조하세요.