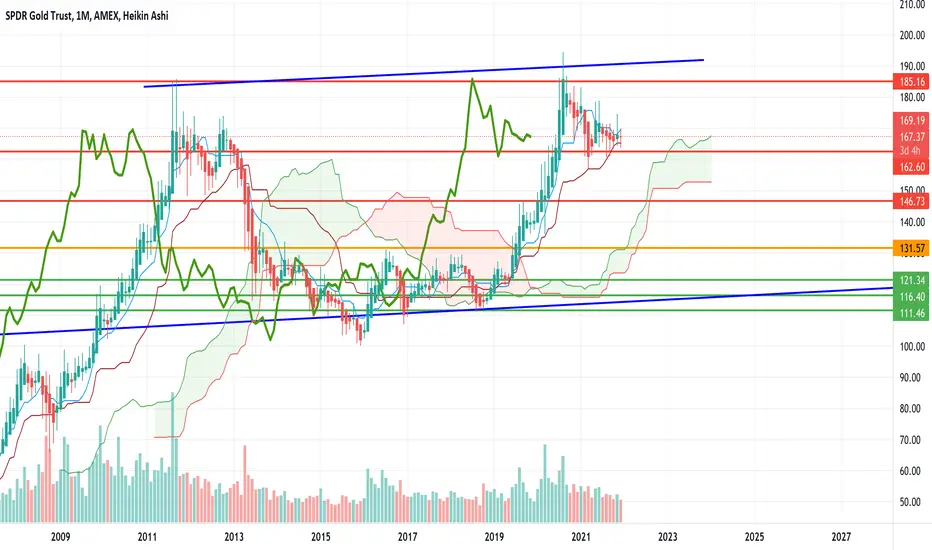
If you zoom out on  GLD, we seem to be trading within a large channel. Price action looks very similar to how it did in 2012 before falling off a cliff.
While everyone has turned bullish on GLD again, citing inflation as a reason for it to be a safe haven, the chart tells a different story. There seems to be strong resistance right above where we are and lots of room to fall lower from here.
Based on the chart, I think over the next 2-3 years, we'll see the price fall to the $131 level in orange, if not lower. I could see price going all the way down to the $116-120 level at the bottom of the channel before bouncing. I marked off buy areas in orange and green as I think it'd start to make sense to scaling into those regions should price get there.
If price falls below $146, that would be the signal that this move is likely to play out. Let's see how this longer term projection plays out.
면책사항
이 정보와 게시물은 TradingView에서 제공하거나 보증하는 금융, 투자, 거래 또는 기타 유형의 조언이나 권고 사항을 의미하거나 구성하지 않습니다. 자세한 내용은 이용 약관을 참고하세요.
면책사항
이 정보와 게시물은 TradingView에서 제공하거나 보증하는 금융, 투자, 거래 또는 기타 유형의 조언이나 권고 사항을 의미하거나 구성하지 않습니다. 자세한 내용은 이용 약관을 참고하세요.