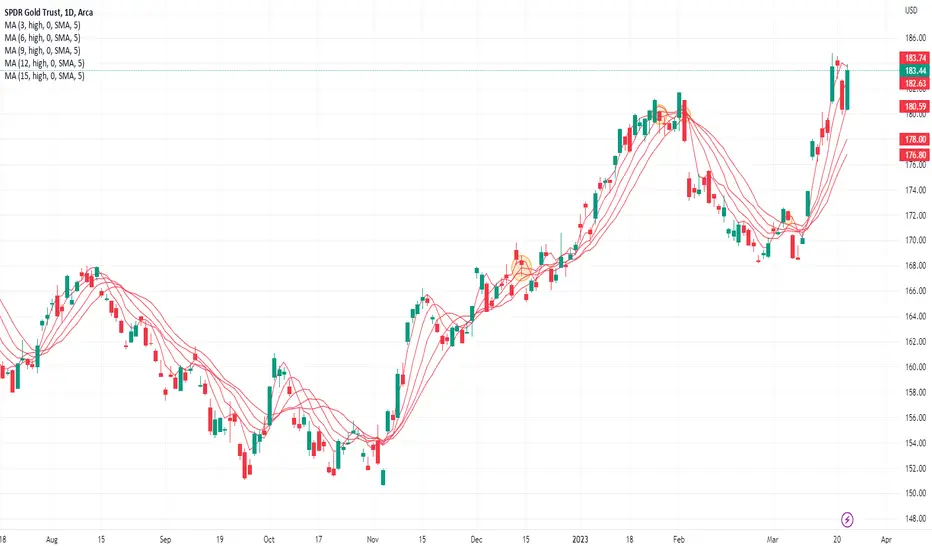
So I am going to try to share the template for this analysis so community can see what I am seeing. But here anyway is the indicator set if creating manually. Use the moving average of highs for the 3,6,9,12,15 day moving average of highs on the GLD chart. Look at the last 6 months or so. The MA is flat on these dates and would per the method indicate a short trade with price penetrating from above at each of those dates being: Dec 14, Jan 26, Feb 2, Mar 6. Maybe I will try to post chart separately. I will do the same with long side trades and some other markets. Any and all feedback is welcome.
면책사항
이 정보와 게시물은 TradingView에서 제공하거나 보증하는 금융, 투자, 거래 또는 기타 유형의 조언이나 권고 사항을 의미하거나 구성하지 않습니다. 자세한 내용은 이용 약관을 참고하세요.
면책사항
이 정보와 게시물은 TradingView에서 제공하거나 보증하는 금융, 투자, 거래 또는 기타 유형의 조언이나 권고 사항을 의미하거나 구성하지 않습니다. 자세한 내용은 이용 약관을 참고하세요.