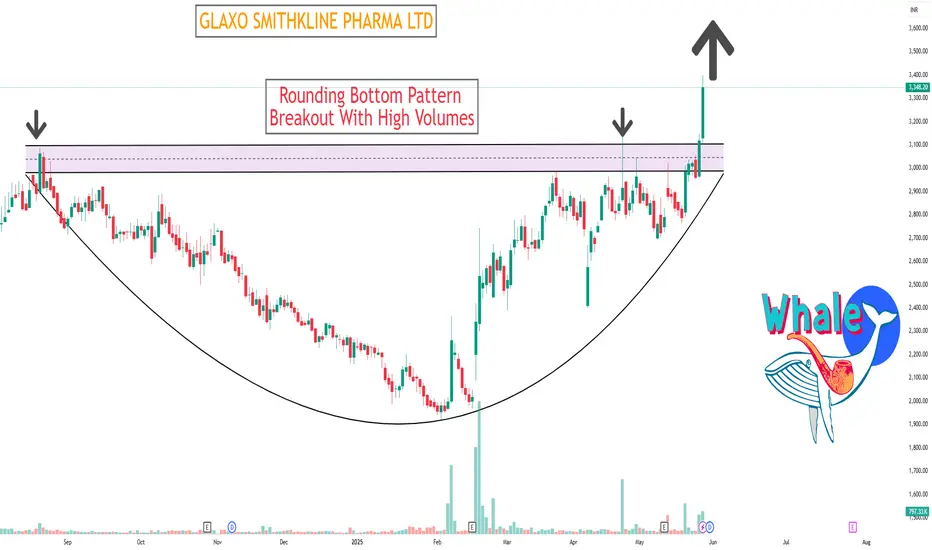
As of May 29, 2025, GlaxoSmithKline Pharmaceuticals Ltd. (NSE: GLAXO) is trading at ₹3,348.20, reflecting a 7.38% increase over the previous close.
📊 Daily Support & Resistance Levels
Based on the latest technical analysis, the key support and resistance levels are:
Support Levels:
S1: ₹3,174.33
S2: ₹2,998.67
S3: ₹2,887.83
Resistance Levels:
R1: ₹3,460.83
R2: ₹3,571.67
R3: ₹3,747.33
These levels are derived from the price range of the previous trading day.
🔍 Technical Indicators Overview
Relative Strength Index (RSI): The RSI is currently hovering around 70, indicating that the stock is approaching overbought territory.
Moving Averages: GLAXO is trading above its 5-day, 10-day, 20-day, 50-day, 100-day, and 200-day simple and exponential moving averages, indicating a strong bullish trend.
📈 Market Sentiment
The technical indicators collectively suggest a strong bullish sentiment for GlaxoSmithKline Pharmaceuticals Ltd. However, the RSI indicates that the stock is approaching overbought territory, which may lead to a short-term correction. Investors should monitor the support and resistance levels closely for potential breakout or pullback scenarios.
Please note that stock market investments are subject to market risks, and it's essential to conduct thorough research or consult with a financial advisor before making investment decisions.
I built a Buy & Sell Signal Indicator with 85% accuracy.
📈 Get access via DM or
WhatsApp: wa.link/d997q0
Contact - +91 76782 40962
| Email: techncialexpress@gmail.com
| Script Coder | Trader | Investor | From India
📈 Get access via DM or
WhatsApp: wa.link/d997q0
Contact - +91 76782 40962
| Email: techncialexpress@gmail.com
| Script Coder | Trader | Investor | From India
관련 발행물
면책사항
해당 정보와 게시물은 금융, 투자, 트레이딩 또는 기타 유형의 조언이나 권장 사항으로 간주되지 않으며, 트레이딩뷰에서 제공하거나 보증하는 것이 아닙니다. 자세한 내용은 이용 약관을 참조하세요.