Analysis:
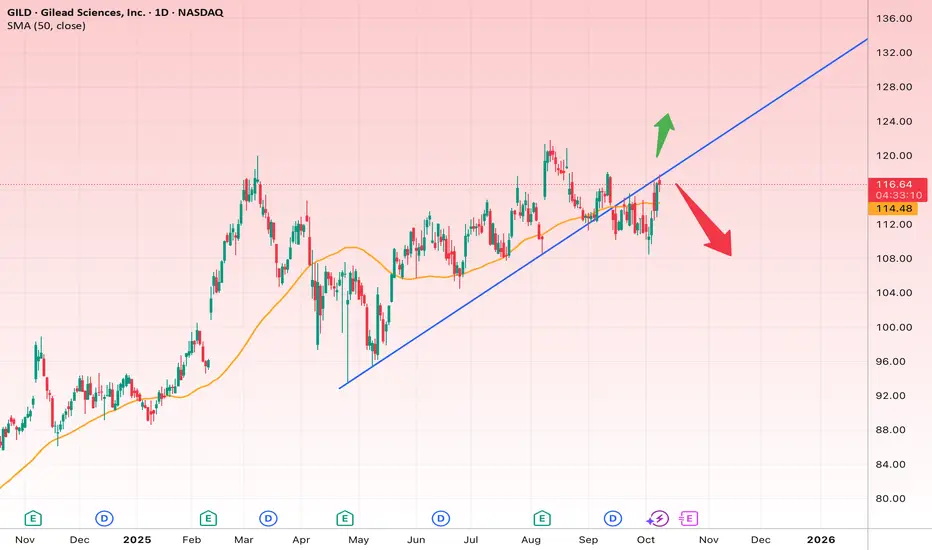
The daily chart of Gilead Sciences (GILD) shows that the stock, after a short-term correction, is once again approaching its main uptrend line (blue). The 50-day moving average (orange) around $114.50 acts as a key support level, and the current price is trading slightly above it.
At this stage, the stock sits at a decisive point — it could either reclaim its bullish momentum by breaking above resistance or enter a deeper corrective phase if support fails.
Short-term outlook (2–4 weeks):
If the price manages to hold above $118, the next upside targets are in the $119.80–$124.80 range. This area represents the short-term bullish objective.
A reasonable stop loss for this scenario is just below $114.
Long-term outlook (2–3 months):
If the stock breaks decisively above $125 and maintains that momentum, the next major targets would be in the $130–$134 range, which also aligns with the previous highs.
However, if the blue uptrend line breaks down and a daily candle closes below $113, a bearish move toward the $106–$108 range becomes likely. In that bearish scenario, the stop loss should be placed above $113.
Overall, GILD is at a decision point. As long as it trades above $114, the bullish outlook remains valid — but losing that support could shift the balance in favor of the bears.
면책사항
이 정보와 게시물은 TradingView에서 제공하거나 보증하는 금융, 투자, 거래 또는 기타 유형의 조언이나 권고 사항을 의미하거나 구성하지 않습니다. 자세한 내용은 이용 약관을 참고하세요.
면책사항
이 정보와 게시물은 TradingView에서 제공하거나 보증하는 금융, 투자, 거래 또는 기타 유형의 조언이나 권고 사항을 의미하거나 구성하지 않습니다. 자세한 내용은 이용 약관을 참고하세요.