Despite weaker than expected factory orders (4th monthly fall) and industrial production (3 year low) data from Germany earlier this week, which both unexpectedly fell, highlighting weaker growth prospects and structural issues that urgently need to be addressed to support the country’s key industrial corporates to deal with the impact of US tariffs and competition from China, the Germany 40 index has steadily moved back towards its all-time high of 24648.
In fact, since the end of a disappointing range bound September, the Germany 40 has risen around 800 points or 3.4% as investors look to rotate back into European markets in a search of lower valuations compared to US companies, especially in the technology sector.
Now, in what has been a week light event week, with Q3 earnings about to start, the focus for traders could be whether the technical trends indicate there is enough momentum to push towards new record highs, or whether the recent gains may lead to some profit taking ahead of the Friday close.
Technical Update: Focus on the All Time High
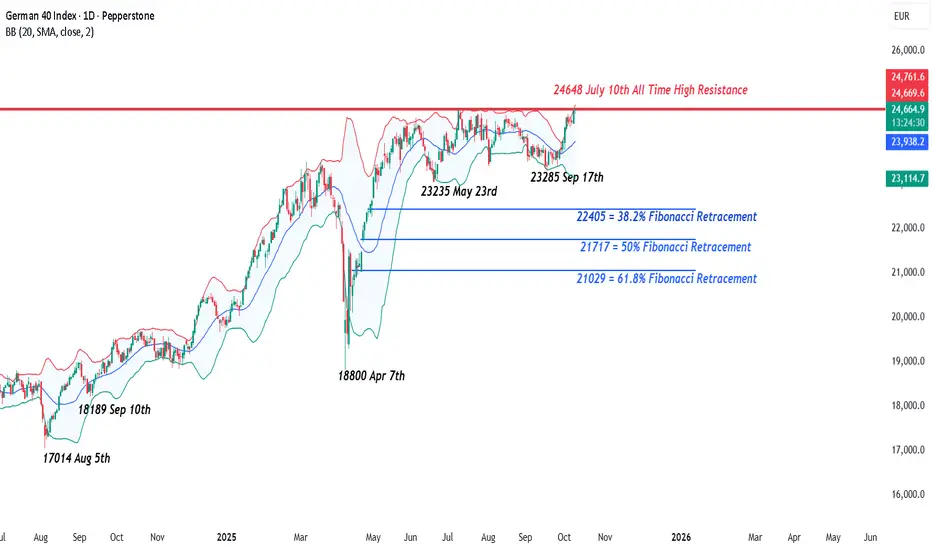
Recent activity in the Germany 40 index has been contained between 23235, the May 23rd session low, and 24648 the July 10th all-time high. The price action within this range has reflected a more balanced tone, with a clear tug-of-war between buyers and sellers.
A decisive closing breakout through either boundary may be needed to suggest the next directional move.

As the chart above shows, the most recent price activity since the 23285 September 17th low has seen prices recover, a move that is now testing the important resistance level marked by the July 10th all-time high at 24648.
Traders could well be watching closely to see if this new strength leads to a clear closing upside breakout, or if the range between 23235 and 24648 is to remain intact.
Potential Resistance Levels:
One could argue that having previously attracted sellers and held firm as a ceiling since July 10th, 24648 remains the first key resistance to watch. A closing break above this level might signal renewed bullish momentum and open the door for further upside in price.

While a close above 24648 doesn’t guarantee continued strength, it could encourage further upside attempts.
When in new all-time high territory, pinpointing resistance becomes more difficult, but Fibonacci extension levels can offer useful reference points. These projections can be used to help frame potential resistance levels.
While a successful close above 24648 has yet to materialise, such a break could prompt traders to shift their focus towards 25162, the 38.2% extension or even 25482, which is the 61.8% level.
Possible Support Levels:
Of course, the July 10th high of 24648 currently remains intact on a closing basis and continues to serve as the first possible resistance level, marking the upper boundary of the current sideways range. As such, it may once again prove effective in capping price strength. If this resistance holds, it could see renewed selling pressure, raising the risk of fresh price declines.

As shown in the chart above, the 24273 low from October 6th, represents the last correction low in the current rally and may now act as an initial support. If this level breaks it could signal potential for downside moves towards 24133, which is the 38.2% Fibonacci retracement, and possibly further to the rising Bollinger mid-average, which currently stands at 24000.
The material provided here has not been prepared accordance with legal requirements designed to promote the independence of investment research and as such is considered to be a marketing communication. Whilst it is not subject to any prohibition on dealing ahead of the dissemination of investment research, we will not seek to take any advantage before providing it to our clients.
Pepperstone doesn’t represent that the material provided here is accurate, current or complete, and therefore shouldn’t be relied upon as such. The information, whether from a third party or not, isn’t to be considered as a recommendation; or an offer to buy or sell; or the solicitation of an offer to buy or sell any security, financial product or instrument; or to participate in any particular trading strategy. It does not take into account readers’ financial situation or investment objectives. We advise any readers of this content to seek their own advice. Without the approval of Pepperstone, reproduction or redistribution of this information isn’t permitted.
In fact, since the end of a disappointing range bound September, the Germany 40 has risen around 800 points or 3.4% as investors look to rotate back into European markets in a search of lower valuations compared to US companies, especially in the technology sector.
Now, in what has been a week light event week, with Q3 earnings about to start, the focus for traders could be whether the technical trends indicate there is enough momentum to push towards new record highs, or whether the recent gains may lead to some profit taking ahead of the Friday close.
Technical Update: Focus on the All Time High
Recent activity in the Germany 40 index has been contained between 23235, the May 23rd session low, and 24648 the July 10th all-time high. The price action within this range has reflected a more balanced tone, with a clear tug-of-war between buyers and sellers.
A decisive closing breakout through either boundary may be needed to suggest the next directional move.
As the chart above shows, the most recent price activity since the 23285 September 17th low has seen prices recover, a move that is now testing the important resistance level marked by the July 10th all-time high at 24648.
Traders could well be watching closely to see if this new strength leads to a clear closing upside breakout, or if the range between 23235 and 24648 is to remain intact.
Potential Resistance Levels:
One could argue that having previously attracted sellers and held firm as a ceiling since July 10th, 24648 remains the first key resistance to watch. A closing break above this level might signal renewed bullish momentum and open the door for further upside in price.
While a close above 24648 doesn’t guarantee continued strength, it could encourage further upside attempts.
When in new all-time high territory, pinpointing resistance becomes more difficult, but Fibonacci extension levels can offer useful reference points. These projections can be used to help frame potential resistance levels.
While a successful close above 24648 has yet to materialise, such a break could prompt traders to shift their focus towards 25162, the 38.2% extension or even 25482, which is the 61.8% level.
Possible Support Levels:
Of course, the July 10th high of 24648 currently remains intact on a closing basis and continues to serve as the first possible resistance level, marking the upper boundary of the current sideways range. As such, it may once again prove effective in capping price strength. If this resistance holds, it could see renewed selling pressure, raising the risk of fresh price declines.
As shown in the chart above, the 24273 low from October 6th, represents the last correction low in the current rally and may now act as an initial support. If this level breaks it could signal potential for downside moves towards 24133, which is the 38.2% Fibonacci retracement, and possibly further to the rising Bollinger mid-average, which currently stands at 24000.
The material provided here has not been prepared accordance with legal requirements designed to promote the independence of investment research and as such is considered to be a marketing communication. Whilst it is not subject to any prohibition on dealing ahead of the dissemination of investment research, we will not seek to take any advantage before providing it to our clients.
Pepperstone doesn’t represent that the material provided here is accurate, current or complete, and therefore shouldn’t be relied upon as such. The information, whether from a third party or not, isn’t to be considered as a recommendation; or an offer to buy or sell; or the solicitation of an offer to buy or sell any security, financial product or instrument; or to participate in any particular trading strategy. It does not take into account readers’ financial situation or investment objectives. We advise any readers of this content to seek their own advice. Without the approval of Pepperstone, reproduction or redistribution of this information isn’t permitted.
Global risk Warning CFDs are complex instruments and come with a high risk of losing money rapidly due to leverage. Between 74-89% of retail investor accounts lose money when trading in CFDs. You should consider whether you understand how CFD
면책사항
이 정보와 게시물은 TradingView에서 제공하거나 보증하는 금융, 투자, 거래 또는 기타 유형의 조언이나 권고 사항을 의미하거나 구성하지 않습니다. 자세한 내용은 이용 약관을 참고하세요.