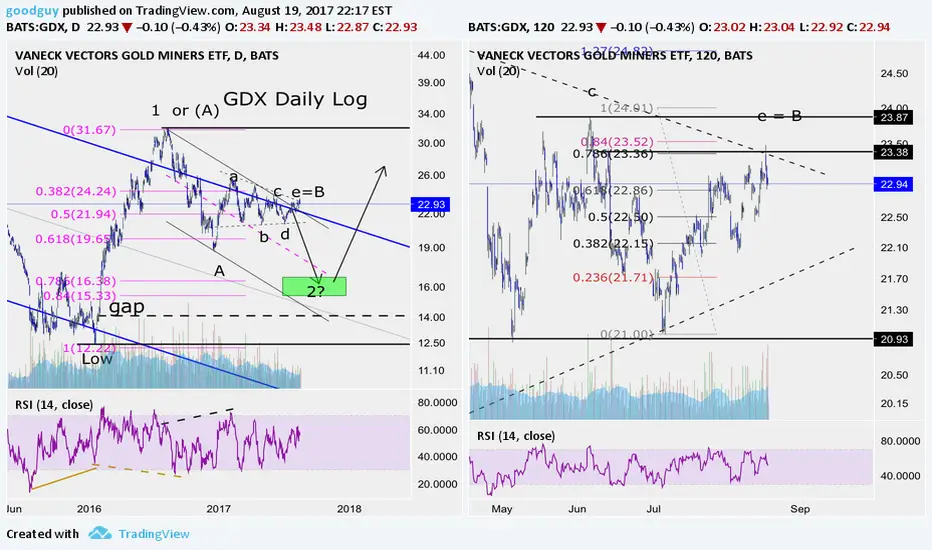
Although I am longer term bullish I am intermediate term bearish and short. I think the sideways triangle is very likely complete with wave "e" going to .78 of wave"c" then reversing intraday for a bearish engulfment candle for the day Would not be be surprised to see it open lower Monday then bounce to retest Friday's high but fail. If price goes above "c" then I'm wrong. Hope this will be helpful.
액티브 트레이드
Getting very close to moment of truth:거래청산: 스탑 닿음
관련 발행물
면책사항
해당 정보와 게시물은 금융, 투자, 트레이딩 또는 기타 유형의 조언이나 권장 사항으로 간주되지 않으며, 트레이딩뷰에서 제공하거나 보증하는 것이 아닙니다. 자세한 내용은 이용 약관을 참조하세요.
면책사항
해당 정보와 게시물은 금융, 투자, 트레이딩 또는 기타 유형의 조언이나 권장 사항으로 간주되지 않으며, 트레이딩뷰에서 제공하거나 보증하는 것이 아닙니다. 자세한 내용은 이용 약관을 참조하세요.