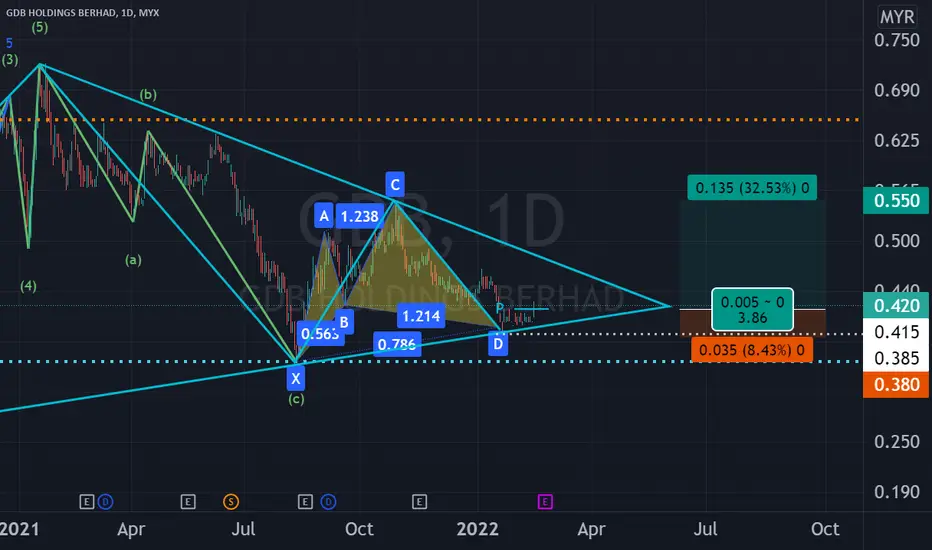
Consider to study, analyze and monitor GDB in its daily chart where the following patterns appear to have been formed: 1. Triangle; 2. Bullish Cypher and 3. EW ABC Corrective Zone at C zone.
Trade within the triangle or trade as per the potential Cypher Pattern Trading Plan as depicted in the chart.
This is not a trade or investment call but for study and sharing purposes only with a view to develop and enhance one's trading knowledge and skill. Trade at your own risk.
Trade within the triangle or trade as per the potential Cypher Pattern Trading Plan as depicted in the chart.
This is not a trade or investment call but for study and sharing purposes only with a view to develop and enhance one's trading knowledge and skill. Trade at your own risk.
면책사항
이 정보와 게시물은 TradingView에서 제공하거나 보증하는 금융, 투자, 거래 또는 기타 유형의 조언이나 권고 사항을 의미하거나 구성하지 않습니다. 자세한 내용은 이용 약관을 참고하세요.
면책사항
이 정보와 게시물은 TradingView에서 제공하거나 보증하는 금융, 투자, 거래 또는 기타 유형의 조언이나 권고 사항을 의미하거나 구성하지 않습니다. 자세한 내용은 이용 약관을 참고하세요.